FLOW AND PRESSURE CONTROL OF A FIELD SPRAYER USING PID CONTROLLER
H. Karadöl
Kahramanmaras Sutcu Imam University, Faculty of Agriculture, Department of Biosystems Engineering, 46100, Kahramanmaras¸ Turkey
*Corresponding author’s E-mail: hayrettinkaradol@gmail.com
ABSTRACT
Recently, different methods have been developed in order to increase the application efficiency of agricultural sprayer systems. The dynamic control of flow and / or pressure is performed by the proportional control of pumps or valves.The aim of the current study was to minimize the application rate error of field sprayers using the pump motor variable speed drive (VSD) of a centrifugal pump system. The flow rate and pressure control of the pump system was achieved using a Proportional Integral Derivative (PID) controller.During the tests, in the first stage, the flow rate-speed ratio was kept at a constant value to apply a constant application rate with varying ground speeds. In the second stage, the control of the system pressure was accomplished using the manually applied disturbing effects on the system. In the final stage, the flow rate of a spray nozzle was controlled by Pulse Width Modulation (PWM) depending on the speed at different constant pressure values. In flow control test, absulute percentage error of application rate in only six out of 150 measurements were higher than 10% which is acceptable application rate error at varying ground speeds from 6 to 10 km h-1. In pressure control tests, it was observed that the controller moved the system pressure back to the set value within 2-3 seconds after a disturbance applied. The system was able to control the nozzle flow rates between 50% and 100% by changing the duty cycle of the signal applied to the solenoid valve at the nozzle inlet during the PWM spray tests. Further investigation is required to test the observation in the current experiment on field sprayers to improve the efficiency of constant and variable rate or PWM applications.
Keywords:PID; Flow based control; Sprayers; Variable rate application
https://doi.org/10.36899/JAPS.2023.3.0649
Published first online February 10, 2023
INTRODUCTION
One of the challenges faced by the producers in agriculture is that the expected effects of chemicals used in spraying are not as desired. The application of pesticides is a necessary process in agricultural production, but is also one of the most hazardous operations (Abbas et al., 2020). In traditional sprayer applications, pesticides are generally applied in medium to high volumes. As the applied doses increase, problems associated with pesticide residue arise such as environmental health and life (Güler et al., 2010; Mercaldi et al., 2017; Wang et al., 2019). Pan et al., (2019) identified 42 different pesticide residues in 530 soil samples collected from an agricultural land in the North China region. Today, product loss caused by pests, diseases and weeds is approximately 35% across the world. Pests (insects, mites, nematodes, etc.) cause 14% loss while diseases 11% and weeds 10% (Kaymak et al., 2015). In order to reduce product losses, the chemical control method is being used for reasons such as short-term effects and less human labor. The impact of rapid technological changes for many agricultural tools contributed to the development of new spraying methods. These developments have resulted in the improvement of both finding a large number of new and effective chemical formulations and the application efficiency of the spraying machines (sprayers) used to deliver these formulations to the plant (Çilingir and Dursun, 2010). In conventional sprayer systems, the application rate is adjusted by changing the pressure of the sprayer. However, the pressure is not a very effective way of changing flow rates. Increasing the ground speed by a factor of 2 requires a four-fold pressure change, as predicted by the square-root relationship between flow rate and pressure (Wolf, 2020). In addition, in these sprayers, the lack of a dynamic control system that provides the regulation of the liquid sent to the boom spraying sections causes an increase in application errors in case of changes in the speed rate and boom width (boom sections or nozzle). On the other hand, due to the reasons mentioned above, the operator tries to keep both the tractor speed and the system pressure at a constant value to prevent application rate errors during the application. However, this situation is often not possible under field conditions and with the constantly changing pressure value, the pulverization characteristic (spray angle, drop diameter and velocity) are adversely affected.
Different spray application techniques have been developed to reduce the amount of pesticides applied in spray systems and to increase the efficiency of the application. Some of them are; Constant and Variable Rate Applications (Hamburg, 1999; Giles et al., 1996; Gil et al., 2007; Zhai et al., 2012; Liu et al., 2012; Sabancı and Aydın, 2014). Automatic Section Control (Saharda et al., 2011; Shockley et al., 2012) and Pulse Width Modulation (PWM) technique applications (Butts et al., 2019; Salcedo et al., 2020). In recent years, pressure-based sprayers have been replaced by flow-based sprayers. Control of the liquid in the pressure line is mostly regulated with a proportional valve system in flow-based spraying systems, which are being marketed and used increasingly. However, it is understood that the sensitivity of the control methods used in these systems in terms of response time and stability is not sufficient (Saharda et al., 2013a). Considering that the components of the spray system are correctly calibrated, the factors that affect the application rate during spraying are the ground speed and the flow rate sent to the nozzles. The objective of the experimental research is to investigate the effect of PID controller for field sprayers on flow rate, pressure and PWM spraying technique on a centrifugal pump which has fast Variable Speed Drive (VSD) system.
MATERIALS AND METHODS
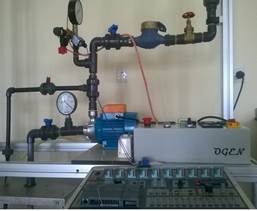
Materials: The current experiment was carried out in Kahramanmaras Sutcu Imam University Faculty of Agriculture, Turkey in 2021 in July. All experiments were conducted on a centrifugal pump test bench (Figure 1). The test system includes a water tank, foot valve with suction strainer, vacuum meter, inlet flow rate valve, bypass valve, a centrifugal pump driven by an electric motor, an analog manometer, output flow rate control valve, a solenoid valve (SMS Tork, S1018) to drive the nozzle (LECHLER 110-02, Germany) with the PWM signal, an outlet pressure sensor (Gems 0-6 bars) and a control panel to drive the electric motor proportionally. The system includes two flowmeters, the first one is an analog flowmeter (LSZ-32, 0-4 m3h-1) and the second one (Mikronet ARF-4SS) is an electronic turbine flowmeter.
Figure 1. Centrifugal pump test bench
In this study, a PLC (Siemens 1214C ) was used to control the system. The PLC has 8 digital inputs, 6 digital outputs and 2 analog inputs with 10 bit resolution. In addition, 6 digital inputs can be assigned as High Speed Counter (HSC) input to read signals up to 100 kHz with the program (Siemens, 2020). One of digital input terminals (I0.1) of the PLC is assigned as the high speed counter input and the pulse values from the flowmeter was read. Also, a solid-state relay (BI-M-75-10, China) was used to drive the selonoid valve with a 10 Hz PWM signal depending on the variable operating speed (electrical signal applied to the PLC analog input terminal). The SSR relay has 12 V - 50 V operating range, can be triggered up to 10 kHz and 5 A continuous-state operating current.
Methods: Flow and pressure controls were done using the PID controller for the above mentioned pump system. At this point, the main aim was to examine the ability of the PID controller to compensate the flow rate and pressure for the field sprayer. The PID controller calculation (algorithm) involves three separate parameters: the proportional (Kp), the integral (Ki) and derivative (Kd) time constants. The proportional gain determines the reaction to the current error, the integral determines the reaction based on the sum of recent errors and the derivative determines the reaction to the rate at which the error has been changing. The weighted sum of these three actions is used to adjust the process via a controller such as the position of a proportional valve or the power supply of a heating element (Scilab, 2020). The block diagram of a generic closed-loop control system involving the closed-loop process-control system with PID controller has been shown in Figure 2
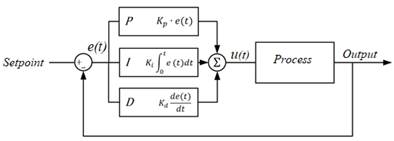
Figure 2. Closed-loop process-control system with PID controller
Where the tuning parameters Kp, Ki and Kd refer to the proportional, integral and derivative gains respectively. The PID controller computes the error value (e(t)) as the difference between a setpoint and measured output. The purpose is to minimize the error over time by modifying the control variable (u(t)).
Before starting the tests, PID coefficients for both flow rate and pressure control were determined automatically by the 'Tia Portal’ (Totally Integrated Automation Portal) program 'PID compact' unit. While determining the PID parameters for flow rate control, the amplitude of the signal applied from the DC power source to the PLC 'AI-1' analog input terminal was changed at certain intervals (speed change). In the pressure control phase, disruptive effects were applied on the system pressure by slightly opening or closing the outlet valve. At this stage, the main purpose was to determine the PID parameters depending on the rate of change in flow rate and pressure values in the system. The coefficients determined using the PID auto-tune feature are shown in Table 1.
Table 1. PID parameters calculated by the controller fine tuning
|
PID parameters
|
Flow rate control
|
Pressure control
|
|
Proportional gain
|
4.2067
|
2.8808
|
|
Integral action time
|
2.9927
|
0.2248
|
|
Derivative action time
|
0.7982
|
0.0276
|
|
Derivative delay cofficient
|
0.1000
|
0.1000
|
|
Proportional action weighting
|
0.5213
|
1.0000
|
|
Derivative action weighting
|
0.0000
|
0.0000
|
|
Sampling time of PID algorithm
|
0.1000
|
0.1000
|
The application rate in a field sprayer varies depending on the values presented in Equation 1 (Kasap et al., 1999; Mercaldi et al., 2017).
 (1) (1)
where, N is application rate (L ha-1), Q is flowrate (L min-1), B (m) is the distance the nozzles location in the boom (m) and V is the sprayer ground speed (km h-1). Boom working width was taken to be 10 m in the evaluations in Eq. 1.
During the tests, despite the changing speed value at the first stage, the pump output flow rate (Q) was changed through the pump motor variable speed drive (VSD) and the 'Q/V'ratio was tried to be kept at constant around 3.6 L min-1h km-1. Thus, actual application rate value was kept at 216 L ha-1. The pulse signal received from the flowmeter was applied to the PLC I0.0 digital input terminal and this signal value is multiplied by a calibration number specified by the manufacturer to calculate the flow rate. Then, the flow rate was divided by the speed value (6-10 V, 6-10 km h-1) entered from the DC power source, denoted as 'Q/V'. Speed signal was changed manually from a potentiometer on the power supply. In order to create a closed loop control system, the PLC memory fields containing the 'Q/V' and the target flow valueswere defined at the PID input terminals.
In the second stage, the pressure data obtained from the pressure sensor was applied to the PLC analog input (AI-0). At this step, the pressure information received from the pressure sensor and the targeted pressure value in the system were defined to the PID input terminals. Thus, the controller generated an output signal based on the error value between the specified targeted input value and the sensor value (flow rate or pressure) applied to the analog input terminal. The centrifugal pump variable speed drive operated the pump proportionally in the range of 0 V (0%) - 4.98 V (100%) (the value measured from the VSD potentiometer terminals). For this reason, PID block output signal (0-10 V) was normalized to 0-4.98 V. PLC memory fields of the system variables (speed, flow, pressure, PID output voltage) are defined in the 'Data Logging' block and the data is transferred to the 'Microsoft Excel' at intervals of 1 s. All analyses were carried out using these data of system variables. In the flow control tests phase, Equation 2 was used to determine the errors in the application rate value. The general structure of the created system can be seen in Figure 3.
 (2) (2)
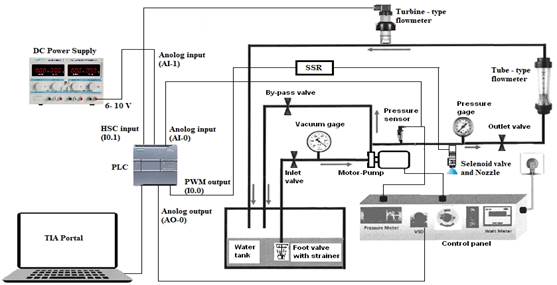
Figure 3.General structure of the system.
RESULTS AND DISCUSSION
During the tests, at the first stage, the PID controller response was examined to keep the system's application rate at the pre-determined set value. The PID controller set value (targeted Q/V value) was determined and the variable values of the system were recorded at 1 s intervals. In Figure 4, the target rate is 216 L min-1 and the change of the system application rate(60 * Q/V) can be seen when changing the speed value between 6-10 V values for approximately 150 s. Here, it has been observed that the controller keeps the rate value constant in the range of certain limits against speed change.
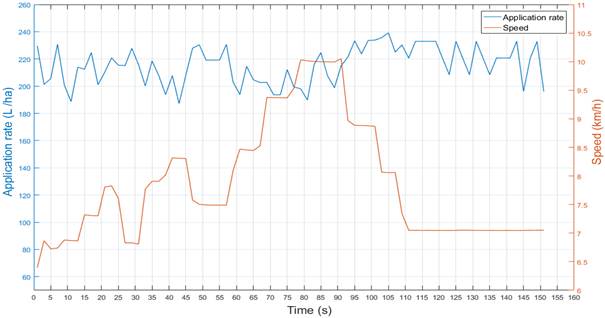
Figure 4. Changes of application rate and speed over time.
In Figure 5, as the 'Q/V' ratio decreases if the speed increases, the PID controller output signal also increases at a certain rate, increasing the flow rate by increasing the power transmitted to the pump through the VSD. Thus, the 'Q/V' ratio approaches the desired set value again. If the speed is decreased, it is clearly seen that the flow rate decreases. In addition, even if the speed value does not change, inconsistent measurments of flowmeter were obtained, possibly due to flowmeter measurement error or turbulent flow situations. Against these changes, the controller keeps the deviations in the flow rate under certain limits by generating an output signal in the opposite direction (between 140-150 s).
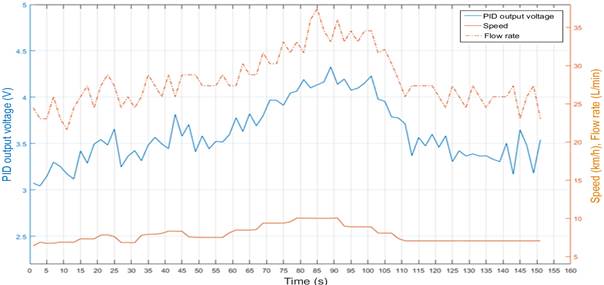
Figure 5. Flow rate control by PID output signal against changing speed value.
In Figure 6, the change of the system rate against the PID controller output signal is seen more closely. If the application rate deviates from the targeted rate (set value, 216 L min-1), the controller produces an output signal in the direction limiting this change.
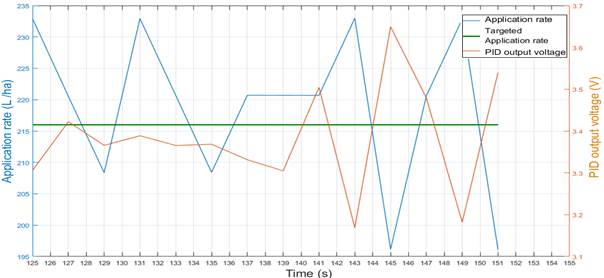
Figure 6. Relation of application rate and PID output signal
In some commercially available automatic section control (ASC) sprayers, as a result of the opening or closing of the nozzle or nozzle groups on the sprayer boom, the time to return to the set value of the total flow sent to the boom sections is more than 20 seconds and It is reported that the errors in the application rate during this period often exceed the acceptable limit of 10% (Saharda et al., 2013b). However, according to the BS EN ISO 16119-2: 2013 standard (BSI 2020), it is stated that the application rate should not change more than 10% according to the desired value after one or more of the nozzle groups are opened and closed or 7 seconds after the speed change.In this experimental study, the flow rate regulation was carried out by the pump of the system whose speed can be changed in real time and it was seen that the system could reach the set value quickly. Error values occurring in the application rate (Lha-1) are shown in Figure 7.
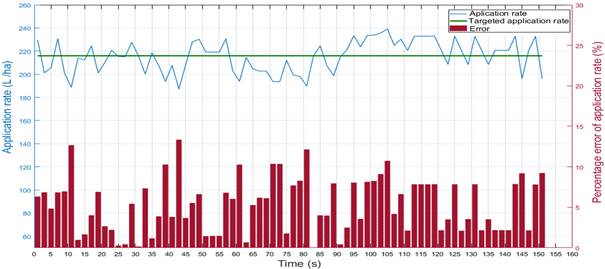
Figure 7. Percentage error of application rate.
The high sensitivity and resolution of the feedback signal applied to the controller can significantly reduce the error rate.Although there are deviations in the pulses taken from the turbine type flowmeter during the tests, it is seen that the maximum absolute error rate of the controller is at the level of 12-13%. The turbine type flowmeters have better performance than the electromagnetic flowmeters with regard to response time (<500 ms), on the other hand their accuracy was slightly lower (Escolà et al., 2013). It is thought that the error rate will decrease significantly if a higher quality turbine type flowmeter is used.In some sprayer systems, the flow rate must change at a certain rate, while the pressure must remain stable for a constant pulverization characteristic. In the study, the pressure control method is the same as the flow control method, but a 4-20 mA (0-6 bar) signal received from the pressure sensor was applied to the PID input terminal instead of the flowmeter pulse signal. In Figure 8, the system pressure is set to 2.5 bar and disruptive effects (small openings and closings of the outlet valve quickly) are applied at certain intervals through the outlet valve. The controller carried the system pressure back to the set value within 2-3 seconds after the disturbent is applied.

Figure 8. PID output signal pressure relationship against disturbance.
Figure 9 shows the pressure-flow rate relationship when the pressure was set to 2.8 bar. Here, it is seen that when the outlet valve is momentarily throttled during the test, the pressure increases a little, and as a result, the controller reduces the flow rate. On the other hand, if the valve is momentarily opened, the pressure decreases and the controller increases the flow rate and moves the pressure back to the set point.
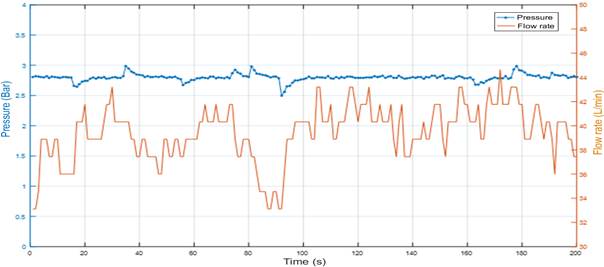
Figure 9. Changes in pressure and flow rate in case of disturbing effect
In PWM spraying tests, a 10 Hz pulse signal was applied to the solenoid valve mounted on the sprayer nozzle inlet at constant pressure values through the controller output unit. It was observed that the duty cycle of the signal changes depending on the speed value (5-10 V) applied to the controller analog input terminal (Figure 10). If the voltage applied to the controller analog input terminal is at 5 V, it means that the 100 ms period pulse signal provides energy to the solenoid valve coils for 50 ms.Thus, spraying is made by opening the valve for 50 ms, and no spraying is made by closing the valve for the remaining 50 ms. During the trials, the pressure at the solenoid valve inlet was kept constant at 2.5, 3.0, 3.5 and 4.0 bar, respectively.As a results, the difference between 90% and 100% of the signal duty cycle decreased in the tests performed for all pressure valuesdue to the valve's inability to respond quickly, since the off time of the solenoid valve was only 10 ms.
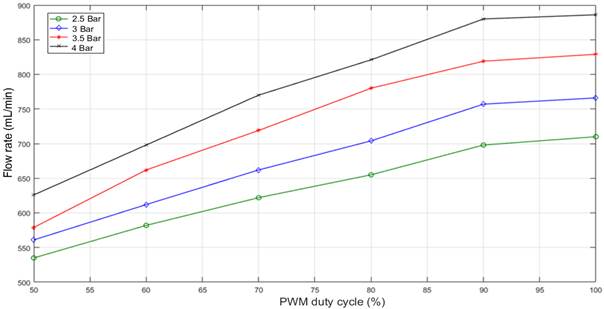
Figure 10. Flow rate depending on the PWM signal duty cycle at different pressure values
Conclusions: In this research, a test set up including a centrifugal pump with variable speed drive was driven proportionally using a PID controller to increase the application efficiency of a field sprayer. In constant rate application tests, varying speed values were applied to the system as a variable electrical signal, and it was observed that the controller regulated the flow rate value with a maximum absolute error value of 12%. In future studies, it is thought that application errors can be minimized significantly if fast response (2-3s full opening or closing time) proportional valves and adaptive PID controller will be used.
REFERENCES
- Abbas, I., J. Liu, M. Faheem, R. S. Noor, S. A. Shaik, K. A. Solangi and S. M. Raza (2020). Different real-time sensor technologies for the application of variable-rate spraying In agriculture. Sensors and Actuators A., 316: 112265.
- BSI, EN ISO (2020). Agricultural and forestry machinery. Environmental requirements for sprayers. Horizontal boom sprayers. Retrieved in October, 12, 2020 from https://shop.bsigroup.com/ProductDetail?pid=000000000030376269
- Butts, T. R., L. E. Butts, J. D. Luck, B. K. Fritz, W. C. Hoffmann and G. R. Kruger (2019). Droplet size and nozzle tip pressure from a pulse-width modulation sprayer. Biosystems Engineering. 178: 52-69
- Çilingir, İ and E. Dursun (2010). Plant Protection Machines. Edit. Ankara University Faculty of Agriculture Publishers, Ankara (Türkiye). 28-35.
- Escolà, A., J. R. Rosell-Polo, S. Planas, E. Gil, J. Pomar, F. Camp and F. Solanelles (2013). Variable rate sprayer. Part 1–Orchard prototype: Design, implementation and validation. Computers and electronics in agriculture, 95: 122-135
- Gil, E., A. Escolà, J. R. Rosell, S. Planas and L. Val (2007). Variable rate application of plant protection products in vineyard using ultrasonic sensors. Crop Protection, 26 (8): 1287-1297
- Giles, D. K., G, W. Henderson and K. Funk (1996). Digital control of flow rate and spray droplet size from agricultural nozzles for precision chemical application. Precision Agriculture, 1: 729-738
- Güler, H., E. Urkan, M. Tozan, A. B. Tekin and Ö. Caner (2010). Technological Developments in Agricultural Control Mechanization. Proceedings of the 7th Congress on Agricultural Mechanization and Energy Agricultural Engineering, 11-15 January, Ankara
- Humburg, D (1999). Variable rate equipment–technology for weed control. Site-Specific Management Guidelines, SSMG-7
- Kasap, E., B. Engürlü, Ö. Çiftçi, S. K. Kılınc, M. Gölbaşı and A. M. Mustafa (1999). Plant Protection Machinery. Ministry of Agriculture and Rural Affairs, Course Tools and Equipment, Machinery Training Center Directorate Publishers, Ankara: 75-77
- Kaymak, S., A. Özdem, A. Karahan, B. Özercan, P. Aksu, A. Aydar and P. Erdoğan (2015). Evaluation of agricultural inputs in our country. Republic of Turkey, Ministry of Food, Agriculture and Livestock, General Directorate of Agricultural Research and Policies
- Liu, H., H. Zhu, Y. Chen, Y. Shen and H. E. Ozkan (2012). An electronic flow control system for a variable-rate tree sprayer. In: American Society of Agricultural and Biological Engineers, 29 July - 1 August, Texas: 122-130
- Mercaldi, H.V., E.A. Peñaloza, R.A. Mariano, V.A. Oliveira and P.E. Cruvinel (2017). Flow and Pressure Regulation for Agricultural Sprayers Using Solenoid Valves. IFAC-PapersOnLine, 50: 6607-6612
- Pan, L., X. Feng, M. Cao, S. Zhang, Y. Huang, T. Xu and H. Zhang (2019). Determination and distribution of pesticides and antibiotics in agricultural soils from northern China. RSC advances, 9: 15686-15693
- Sabancı, K and C. Adın (2014). Image processing based precision spraying robot.Journal of Agricultural Sciences, 20: 406-414
- Salcedo, R., H. Zhu, Z. Zhang, Z. Wei, L. Chen, E. Ozkan and D. Falchieri (2020). Foliar deposition and coverage on young apple trees with PWM-controlled spray systems. Computers and Electronics in Agriculture, 178: 105794.
- Scilab (2020). PID Controller. Retrieved in October, 30, 2020 from https://help.scilab.org/docs/5.4.1/en_US/PID.html
- Sharda, A., J. D. Luck, J. P. Fulton, T. P. McDonald and S. A. Shearer (2013). Field application uniformity and accuracy of two rate control systems with automatic section capabilities on agricultural sprayers. Precision agriculture, 14: 307-322.
- Sharda, A., J. P. Fulton, T. P. McDonald, C. J. Brodbeck (2011). Real-time nozzle flow uniformity when using automatic section control on agricultural sprayers. Computers and electronics in agriculture, 79: 169-179.
- Shockley, J., C. R. Dillon, T. Stombaugh and S. Shearer (2012). Whole farm analysis of automatic section control for agricultural machinery. Precision Agriculture, 13: 411-420.
- Simens (2020). S7 1200 PLC features. Retrieved in May, 12, 2020 from https://cache.industry.siemens.com/dl/files/465/36932465/att_106119/v1/s71200_system_manual_en-US_en-US.pdf
- Wang, A., W. Zhang and X. Wei (2019). A review on weed detection using ground-based machine vision and image processing techniques. Computers and electronics in agriculture, 158: 226-240.
- Wolf, T (2020). Rate Controllers and Spray Pressure. Retrieved in Agust, 22, 2020 from https://sprayers101.com/rate-controller-pressure/
- Zhai, C. Y., X. Wang, D. Y. Liu, W. Ma and Y. J. Mao (2012). Nozzle flow model of high pressure variable-rate spraying based on PWM technology. In Advanced Materials Research, 422: 208-217
|