MODELING VAGINAL CANCERS AMONG LABORATORY ANIMALS THROUGH WEIBULL-RAYLEIGH (WR) DISTRIBUTION
M. Bilal1, M. Moshin1, and S. Abbas1
1Department of Statistics, COMSATS University Islamabad, Lahore Campus, Lahore 54000, Pakistan
Corresponding Author’s email:mbilal@uvas.edu.pk
ABSTRACT
There is a growing interest of scientists in using various distribution models in the detection of incidence, management, and treatment success of cancers in both humans and animals. This study presents a new life model named Weibull-Rayleigh (WR) distribution for estimating the incidence of vaginal cancers in laboratory animals. The data is used for rats in which carcinoma was induced by using DMBA and the proposed distribution was applied to estimate detection accuracy. Several mathematical characteristics including moments, moment generating function, entropy, order statistics, and quantile functions were calculated. The method of maximum likelihood was followed to estimate the various model parameters. It was found that the newly proposed Weibull Rayleigh distribution was valid in all respects for the real lifetime data with much better accuracy. The newly proposed distribution will enable researchers to work out on the incidence of carcinomas among animals with more accuracy.
Keywords: Carcinoma, Incidence of cancers, Weibull-Rayleigh distribution, Generating function, Moments,
INTRODUCTION
Cancer is a significant health issue with high mortality rates that starts from uncontrollable abnormal cell growth. The most prominent form of cancer is carcinoma. It begins in the skin’s epithelial tissue or the tissue linings of internal organs, such as the liver, kidneys, or vagina. Carcinoma has the ability to spread other areas of the body or it may be limited to their primary location (Lodish et al., 2000).
Vaginal carcinoma is one of the types, which specifically affects vaginal linings and damage them. Vulvar and vaginal tumors account for 2.4% to 3% of canine neoplasms (Klein, 2007).In mare, 20% of all tumors are squamous cell carcinoma. Among these tumors, 12% cases are of perianal, vaginal and vulva tumors (Hoffman et al. 1998). In cattle, the vaginal and cervical tumors have also been reported (Oliveira-Pimenta- et al. 2011). However, it is a rare condition in human females as about 1 in 100,000 women are diagnosed with it (Gadducci et al. 2015). This number contributes to approximately 1-2% of all female genital tract malignancies (Adams and Cuello 2018). Vaginal cancer may be primary (originating in vaginal linings) or metastatic. However, the majority of the vaginal carcinomas are metastatic and frequently originating from breast, endometrium, ovary, vulva, cervix, kidneys, and rectum (Dunn and Napier 1966).
In the last half a century, tremendous progress has been made in understanding the genetic and biochemical mechanisms that underlie cancer. Notwithstanding these advancements, cancer remains a significant health concern blamed for one in four adult deaths (Siegel et al. 2011). High death levels suggest that this information will not turn into successful therapies for cancer (Denkert et al. 2010). During World War I chemotherapy was discovered in nuclear arms. Being used in cancer treatment in the 1940s while the disease was least known (Goodman et al. 1946) and remains the most popular method of medication for most cancer types. Cancer is treated with standard methods of surgery, radiation, and chemotherapy moreover new therapies immunotherapy and radio sensitizers are also being used. However, regarding cancer management, a strengthening concern is that there must be a greater focus of researchers and physicians on estimating the incidence of cancer well before the time with more accuracy. However, with the development of the latest statistical techniques for estimation and probability distributions, scientists are trying to investigate the occurrence of this disease and are prone to patients on real lifetime data.
Numerous statistical distributions can be fitted in real-life phenomena. However, in most of the situations, the real data set does not follow the existing distributions. Hence, there is a dire need for such a workable distribution that can explain real data with more accuracy. The Weibull distribution was introduced by Weibull (1951), a Swedish physicist. It is one of the most commonly used models to evaluate lifetime data and treatment efficiency. This model applies to the analysis of reliability, the medical sciences, and the modeling of infant mortality rates, the wear-out periods, etc.
Thus, statisticians have developed many families of the distributions and have studied their properties in various contexts. These include Weibull distribution (Nofal et al. 2017), the Kumaraswamy Marshall-Olkin Frechet distribution (Afify et al. 2016), Lomax generator (Cordeiro et al. 2014), the Weibull exponential (Oguntunde et al. 2015), Weibull-G family (Bourguignon and Cordeiro 2014), the Weibull-Degum distribution (Tahir et al. 2016), and the generalized transmuted-G family of distributions (Afify et al. 2016). In this article, the authors study the principles of statistical modeling and demonstrate implementations of a model built to advance the cancer care system.
MATERIALS AND METHODS
In this study, the data set was taken from Lee and Wang (2003) where the experiment was conducted on 19 female rats as laboratory animals. These rats were painted with a carcinogen named DMBA. The number of days T until the appearance of carcinogenic lesions was of interest, and the data gave the following times (asterisks denote censoring times):
143, 164, 188, 188, 190, 192, 206, 209, 213, 216, 220, 227, 230, 234, 246, 265, 304, 216*, 244*
Weibull-Rayleigh distribution
The newly proposed and used Weibull distributions with distribution function (cdf) are given as:
 (1) (1)
Where  is the function of any baseline distribution, is the function of any baseline distribution,  and and  are shape parameters, and are shape parameters, and  is the scale parameter. One can generate several new distributions by different choices of is the scale parameter. One can generate several new distributions by different choices of 
A new lifetime model for the choice of  as Rayleigh distribution was devised as follows: as Rayleigh distribution was devised as follows:
Let ‘x’ be a continuous random variable of Rayleigh with cdf as
 (2) (2)
and density function (pdf) is given as
 (3) (3)
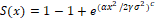
By using (1) and (2), the cdf of WR distribution is obtained as

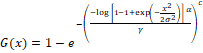 (4) (4)
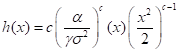
The corresponding pdf is derived by differentiating (4) and given as
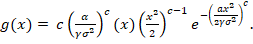 (5) (5)
where and are shape parameters,  and are scale parameters. Figures 1- 4 present graphs of pdf for different combinations of parameters. Different shapes of density plots evident its vast range of applications. and are scale parameters. Figures 1- 4 present graphs of pdf for different combinations of parameters. Different shapes of density plots evident its vast range of applications.
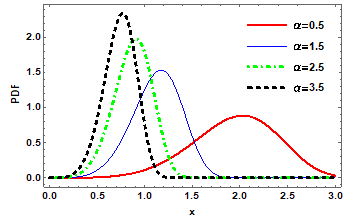
Figure 1: The graph of density function for WR distribution at 

Figure 2: The graph of density function for WR distribution at 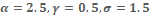

Figure 3: The graph of density function for WR distribution at 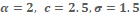
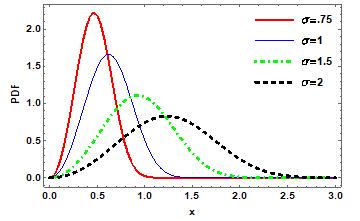
Figure 4: The graph of density function for WR distribution at 
RESULTS
The statistical characteristics of the WR distribution are given below which verify the utility of the newly proposed model for studying the phenomenon of vaginal carcinoma in laboratory animals i.e. rats and validate the distribution for related experiments.
Moments: Moments play a vital role in the investigation of mean, variance, Skewness, and kurtosis. The path-moment about the origin for any probability model is defined as
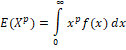
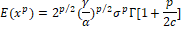
for different choices of  , we can find the mean and variance of the proposed distribution. The mean of the newly proposed model is obtained by replacing , we can find the mean and variance of the proposed distribution. The mean of the newly proposed model is obtained by replacing  and given as and given as
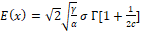 . .
Table 1 and Table 2 report the estimated values of the mean and variance at different combinations of the parameters.
Table 1 Estimated mean of the WR distribution at  and several choices of other parameters and several choices of other parameters
|

|
|

|

|
3
|
4
|
5
|
|
1
|
1
|
0.740075
|
1.480149
|
2.220224
|
|
2
|
1.046623
|
2.093247
|
3.13987
|
|
3
|
1.281847
|
2.563693
|
3.84554
|
|
2
|
1
|
0.640923
|
1.281847
|
1.92277
|
|
2
|
0.906402
|
1.812805
|
2.719207
|
|
3
|
1.110112
|
2.220224
|
3.330335
|
|
3
|
1
|
0.573259
|
1.146519
|
1.719778
|
|
2
|
0.810711
|
1.621422
|
2.432133
|
|
3
|
0.992914
|
1.985828
|
2.978742
|
Table 2 Estimated variance of the WR distribution at and several choices of other parameters
|
|
|
|
|
3
|
4
|
5
|
|
1
|
1
|
0.043108
|
0.172431
|
0.387969
|
|
2
|
0.086215
|
0.344861
|
0.775938
|
|
3
|
0.129323
|
0.517292
|
1.163907
|
|
2
|
1
|
0.032331
|
0.129323
|
0.290977
|
|
2
|
0.064661
|
0.258646
|
0.581953
|
|
3
|
0.096992
|
0.387969
|
0.87293
|
|
3
|
1
|
0.025865
|
0.103458
|
0.232781
|
|
2
|
0.051729
|
0.206917
|
0.465563
|
|
3
|
0.077594
|
0.310375
|
0.698344
|
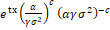
Generating Functions: The Moment generating function is defined as:
Let X be a continuous random variable and the m.g.f is defined as
 
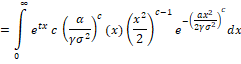
= 
Quantile Function: The quantile function of distribution is defined as:

By using (4) the quantile function of WR distribution is obtained as

Reliability Functions: The survival function  Hazard rate function Hazard rate function  of the proposed distribution is derived using (4) and (5) as of the proposed distribution is derived using (4) and (5) as
Estimation of Parameters using the method of Maximum Likelihood Estimation: The estimation of the model parameter for the complete sample is given here. Let  be the random variables from WR distribution than its likelihood function is given as be the random variables from WR distribution than its likelihood function is given as
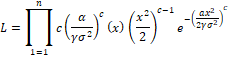
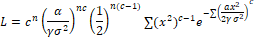
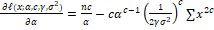
The log-likelihood function is obtained as:
 (6) (6)
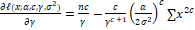
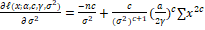
Differentiate equation (6) concerning  respectively respectively
 (7) (7)
 (8) (8)
 (9) (9)
 (10) (10)
Equation (7, 8, 9, and 10) can be solved numerically.
Order Statistics
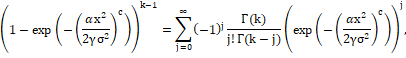
In this subsection, we derive the expression for the pdf of the kth order statistics of WR distribution. Let  is the order statistics of a random sample is the order statistics of a random sample  from a population with cdf from a population with cdf  and pdf and pdf  then the pdf of the kth order statistics then the pdf of the kth order statistics  is given as is given as
 (11) (11)
Using (4) and (5), the kth order statistic of WR distribution is obtained as

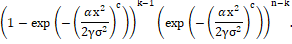 (12) (12)
The density of first-order statistics is given as
 . .
Using the following series expansion given by Prudnikov (1982)

we can write
and hence the pdf of kth order statistics for WR distribution is

The density of first-order statistics is obtained by setting k=1 and is given as

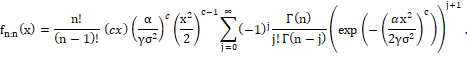
The nth-order statistics is assessed by replacing  as as
Application: In this section, we discuss the applicability of the proposed model in real life scenario. For this purpose, we use data set about the time of survival of the 19 female rats from the disease known as Carcinoma. The results of newly proposed distribution have verified all related parameters, particularly with real-life scenarios and data. This project obtained the value of -2log likelihood (-2l) and the Akaike information criterion (AIC). The WR distribution is compared with exponential and Rayleigh distribution. The results in Table (1) indicate that the WR distribution has the lowest values of -2l and AIC which means that the proposed model is more appropriate to explain the real-life data. The plot of the density function is demonstrated. Figure (5) depicts that WR distribution adequately fits the data.
Table 3: Values of Estimated Parameters and -2log likelihood and AIC
|
Model
|
Estimated Parameters
|
-2l
|
AIC
|
| |

|
|
|
|
|
|
|
Weibull-Rayliegh
|
0.04469
|
8.5570
|
11.7844
|
3.1299
|
191.229
|
199.229
|
|
Exponential
|
0.0046
|
-
|
-
|
-
|
242.177
|
244.177
|
|
Rayleigh
|
0.00002
|
-
|
-
|
-
|
217.357
|
219.357
|
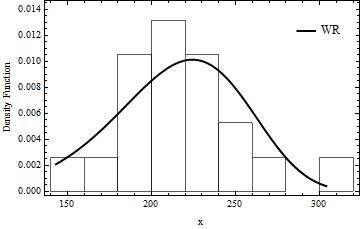
Figure 5: Fitted density plot of WR distribution
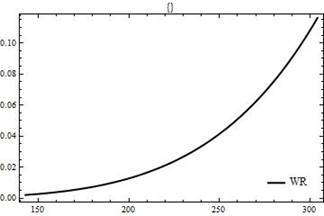
Figure 6: Fitted density plot of WR distribution
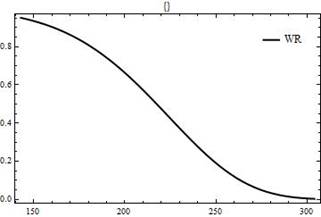
Figure 7: Fitted density plot of WR distribution
CONCLUSION: This article has concluded that the utility of the newly proposed model is much accurate than the previously used distributions particularly dealing with real-lifetime data/models. This Weibull Rayleigh distribution was successfully used to model the real-life data in laboratory female rats for vaginal carcinomas. This study also verified various required parameters for this distribution which were found fit for the data. The results are compared with some existing models, which showed that this model performed better than competing distribution models. The main implication of this study is that this study has presented a new distribution model, which can further be used in detecting the incidence of cancers in animals as well as humans with more accuracy. This future implication of this study is that this model can be further used while doing estimations regarding other diseases as well.
REFERENCES
- Adams, T.S. and A. Cuello (2018). Cancer of the vagina. Int. J. Gynecol. Obstet. 143(2):14-21.
- Afify, A.Z.C., M. Gauss, M. Yousof, H.M. Ayman and Z.M. Nofal (2016). The kumaraswamy transmuted-g family of distributions: Properties and applications. Sci.J. 14(2):245-270.
- Bourguignon, M.S., B. Rodrigo and G.M.Cordeiro (2014). The weibull-g family of probability distributions. Data. Sci. J. 12(1) : 53-68.
- Cordeiro, G.M.O., M.M. Edwin and B.V.P. Popović (2014). The lomax generator of distributions: Properties, minification process and regression model. Appl. Math. Comput.247: 465-486.
- Denkert, C.L., S.Loibl, A.Noske, M. Roller, B.M. Muller, M.Komor, J.Budczies, S. Esfahani, R. Kronenwett, C. Hanusch, C.V. Torne, W. Weichert, K. Engels, C. Solbach, I. Schrader, M. Dietel and G.V. Minckwitz (2010). Tumor-associated lymphocytes as an independent predictor of response to neoadjuvant chemotherapy in breast cancer. J. Clin. Oncol. 28(1): 105-113.
- Dunn, L.J., and J.G. Napier (1966). Primary carcinoma of the vagina am. J. Obstet. Gynecol. 96(8): 1112-1116.
- Gadducci, A., M. G. Fabrini, N. Lanfredini and Sergiampietri (2015). Squamous cell carcinoma of the vagina: Natural history, treatment modalities and prognostic factors. Crit. Rev. Oncol Hemat.93(3): 211-224.
- Goodman, L.S., M.M. Wintrobe, W. Dameshek, M.J. Goodman, A. Gilman and M.T. McLennan(1946). Nitrogen mustard therapy: Use of methyl-bis (beta-chloroethyl) amine hydrochloride and tris (beta-chloroethyl) amine hydrochloride for hodgkin's disease, lymphosarcoma, leukemia and certain allied and miscellaneous disorders. Jama-J. Am. Med. Assoc. 132(3): 126-132.
- Hoffman, H.T.K., G.F.R. Lucy Hynds Funk GFR, A. Robert and H. Menck (1998). The national cancer data base report on cancer of the head and neck.Arch.Otolaryngol. 124(9): 951-962.
- Klein, M. (2007). Withrow & MacEwen’s Small Animal Clinical Oncology Tumors of the female reproductive system. 4th. Ed. p610-618.
- Lee, E.T. and J. Wang (2003). Statistical methods for survival data analysis. 3rd. Ed. J. W. & Sons.
- Lodish, H, A. Berk, S. L. Zipursky P. Matsudaira, D. Baltimore and J. Darnell (2000). Tumor Cells and the Onset of Cancer. In: Molecular Cell Biology, 4th edition. WH Freeman New York
- Nofal, Z.M.A., Z. A. Yousof, M. Haitham and G.M. Cordeiro (2017). The generalized transmuted-g family of distributions. Commun. Stat.Theor.M. 46(8): 4119-4136.
- Oguntunde, P., O. Odetunmibi and A. Adejumo (2015). On the exponentiated generalized weibull distribution: A generalization of the weibull distribution. Indian J. Chem. Technol. 8 (35).
- Oliveira, P.A., J.P. Oliveira-Filho, D.Q. Cagnini, P.R. Badial, E. Cisneros-Álvarez, R. Laufer-Amorim and N.C. Prestes (2011). Squamous cell carcinoma in vaginal fundus in a brahman cow. Arq. Bras. Med. Vet. Zoo. 63(3): 749-752.
- Siegel, R., E. Ward, O. Brawley and A. Jemal (2011). Cancer statistics, 2011: The impact of eliminating socioeconomic and racial disparities on premature cancer deaths. Ca-Cancer. J. Clin. 61(4): 212-236.
- Tahir, M., M. G. Mansoor, M. Zubair and M. A. Morad (2016). The weibull–dagum distribution: Properties and applications. Stat. 45(24): 7376-7398.
- Weibull , W. (1951). A Statistical Distribution Function of Wide applicability. J. Appl. Mech. 103(730): 293-297.
|


