VARIATIONS IN COMMUNITY STRUCTURE AND PLANT SPECIES DIVERSITY WITH SOIL PROPERTIES IN A HYPER-ARID COASTAL DESERT OF EGYPT
A. Amro1, F. M. Salama1,*, M. M. Abd El-Ghani2, A. M. El-Zohary3 and R. M. El-Shazoly3.
1Department of Botany and Microbiology, Faculty of Science, Assiut University, 2Department of Botany and Microbiology, Faculty of Science, Cairo University, 3Department of Botany, Faculty of Science, New Valley University, Egypt
*Corresponding author’s email: fawzysalama2020@yahoo.com
ABSTRACT
Vegetation composition and soil attributes in the lower tributaries were studied from 33 georefereced stands (20 × 20m) in the deltaic part and along the main trunks of studied wadis from north to south of Eastern Desert along the Red Sea coast. The aim of the present study was to investigate the present status of the floristic composition of wadis distributed in the study area, the plant communities inhabiting different habitats and the environmental factors affecting species diversityin the study area. The studied stands were randomly chosen at locations where considerable vegetation cover and/or sensible changes in floristic composition were encountered. In each stand, presence percentage (P%), life forms and chorological affinities for each species were calculated. Soil physico-chemical analyses were carried out, and 16 parameters were used in the multivariate analyses where TWINSPAN (classification) and CCA (ordination) were applied. Significant differences between TWINSPAN vegetation groups were tested by ANOVA. Sixty-three species (40 perennials and 23 annuals) were recorded in this area, belonging to 58 genera from 28 different families. 42% of the recorded flora was belonging to five families arranged descending as: Fabaceae > Brassicaceae > Asteraceae > Chenopodiaceae > Zygophyllaceae. Therophytes and Chamaeophytes constituted 66 % of the main bulk of life form the spectrum of the recorded flora. Also, Saharo-Arabian species consisted 65% followed by the Mediterranean (̴29%). TWINSPAN yielded 5 vegetation groups; group E were located in the proximity of Wadi El-Mallaha and Wadi Beli. Groups A, C and D appeared to be closer to Wadi Dib and W. Abu Had, while stands of group (B) were in Wadi Beli. These groups were clearly separated along the first two axes of DCA. Both diversity indices showed positive significant correlations with phosphates and chlorides, and negative significant correlations with sodium, magnesium, total soluble salts and fine sand. Canonical Correspondence Analysis (CCA) revealed the importance of Na, K, Ca, PO4, gravels, coarse sand, silt and clay in species distribution patterns.
Keywords: desert vegetation, arid environments, soil variables, multivariate numerical analysis, diversity, plant communities
https://doi.org/10.36899/JAPS.2021.6.0372
Published online March 31, 2021
INTRODUCTION
Located in the northeastern part of the Sahara Desert and in the transition between Africa and Asia, the Egyptian deserts linked with those of the Middle East. As in other arid lands, the desert vegetation, which is mainly precipitation-dependent, is the characteristic natural ecosystems in Egypt (Abd El-Ghani et al., 2017), where xerophytic shrubs and sub-shrubs are the dominant life forms.
Flores and Briones (2001) described the main environmental factors that affect the structure and development of plant communities in the arid environments. Arid climate prevails, and together with the long history of human exploitation may have impoverished biotic diversity. Although rain is fall rarely, a rise in ground water table may magnify the chance for serving perennials. On the other hand, unless rainfall occurs, the underground water is considered the main resource for surviving plants in the main channels of the wadis (Zahran and Willis, 2009). Similar investigations were conducted in the other arid regions around the world as in southern Chihuahuan Desert of Mexico (Huerta-Martínez, 2004), in northern foot of Tianshan Mountains of China (Xu et al., 2006), and in the Atacama Desert of Chile (Ruhm et al., 2020).
The vegetation structure of natural ecosystems is determined by biotic factors (e.g. competition, facilitation, and predation), as well as abiotic (Hahs et al., 1999), although the effects of these factors depend on the habitats where the plants grow. The relationship between soil and vegetation is one of the main priorities for restoration projects and vegetation management in ecological studies. Among the different environmental factors, soil is effective for plant growth and is a function of many abiotic factors. The vegetation–environment relationships have always been proved useful in ecological studies (Lundholm and Larson, 2003). Soil, topography and climate showed different influences on the plant distribution at regional (Huerta-Martínez et al., 2004; Abd El-Ghani and El-Sawaf, 2005), landscape (Pan et al., 1998), and smaller scale (Maestre et al., 2003). In the southern part of the Eastern Desert of Egypt, variations in vegetation structure, species dominance and plant communities were investigated (Salama et al., 2014). The soil physical and chemical properties that controlled species and plant communities were electrical conductivity, moisture content, and contents of sodium, potassium, calcium, magnesium, chlorides, sulfates, pH, organic matter and gravel.Tizro and Voudouris (2007) stated that total soluble salts in the soil were affected by the evaporation and precipitation rate and consequently, electric conductivity of the soil solutions was also relatively high. Salama et al. (2012) stated that the high rate of evaporation concentrated the soil solution and affect the plant species composition in the desert landscape.
Generally, the desert ecosystem of Egypt has in recent times been subjected increasingly to untested contacts with humans and their characteristic activities. Within the past 60 years there has been heavy use of desert scrub communities for land reclamation, recreational purposes, military testing, and different construction projects, all of which have modified physical characteristics of soil and altered the composition of desert vegetation and changing floristic composition (Salama et al., 2015).
The population in Egypt is remarkably increased during the last three decades, which entails the establishment of new settlements to overcome this problem. Unfortunately, the establishment of these new cities was on the expense of the natural vegetation which has been removed from these areas. Consequently, vast areas have been modified into massive populated areas, and constructing roads crossing the desert to be easily accessible. The area under investigation is planned to be transformed into a new settlement. Therefore, it is urgently recommended to document the flora and vegetation of such areas before complete vanishing.
The present study was designed to investigate the following: (1) the present status of the floristic composition of wadis distributed in the study area, namely: Wadi Dib, W. Abu Had, W. Mellaha W. Abu Marwa and W. Beli, (2) the plant communities inhabiting different habitats of these wadis and the environmental gradients associated with the species distribution, (3) the environmental factors affecting species diversity in the study area, and (4) comparing the present status flora with earlier records and relevant studies.
MATERIALS AND METHODS
The Study area is a part of the hyper arid Eastern Desert of Egypt. It covers a number of wadis distributed in the area limited by Latitudes 27° to 28 N and Longitudes 33°-34' E, namely: Wadi Dib, W. Abu Had, W. Mellaha and W. Beli(Fig. 1). The soils in these wadis vary according to location in the wadi course and to a great extent to elevation. At up streams, usually coarse sand mixed with gravel, the mid-stream and down-stream locations are of deeper loamy soils, richer in moister, and the down-stream of Wadi Mellaha is a saline depression having a shallow water table and brownish saline soil rich in organic matter (Zahran and Willis, 2009).
Available data revealed that the average lowest minimum temperature through the last five years (2013-2017) was 14 °C recorded in December and the average highest maximum temperature was 33 °C recorded in June. The highest mean relative humidity was 51% (November and December), and the lowest mean was 39% (May, June, July and Augusts). Usually, rainfall occurs in the cold season from October to May but summer is practically rainless. The maximum monthly average of rainfall occurred in October (0.59 mm), while the lowest was in February (0.004 mm).
Thirty-three stands (20m × 20m) were studied in the deltaic part and along the main trunks of the studied 4 wadis from north to south between latitudes 27° to 28°N and longitude 33° – 34°E: Wadi Dib, W. Abu Had, W. Mellaha, and W. Beli, and geo-referenced using GPS techniques.
Taking into account the highly variable abundance of plants (in time and space) in this extreme arid desert environment, the size of stands (20m_× 20m) was designed where the vegetation comprised only of widely spaced shrubs or trees (Abd El-Ghani and Amer, 2003). The sampling of the vegetation was designed, where the stands were randomly distributed within a relatively homogeneous area in terms of topography, landformand physiognomy of present vegetation (Fig. 1).Soil samples were collected from each stand for the physical and chemical analyses.
The plant species were recorded from each stand, and their presence percentage (P%) was calculated. The life forms were classified according to the system of Raunkiaer (1937), and the number of species within each life form was expressed as a percentage of the total number of species. Analysis of phytogeographical ranges was carried out according to Zohary (1966 & 1972) and Abd El-Ghani et al. (2017). Voucher specimens of each species were collected, and identified at the Herbaria of Cairo University (CAI) and Assiut University (ASTU), where they were deposited. Taxonomic nomenclature was according to Täckholm (1974) and Boulos (1995, 1999 & 2000).
Three soil samples (0-50 cm) were collected from different locations from each stand and carried to the laboratory in plastic bags. After mixing these samples, one composite sample was formed, air-dried, thoroughly mixed and passed through a 2 mm sieve to remove gravel and debris. Finer samples were used for soil texture and moisture analyses. Soil texture was determined by the hydrometer analysis (Bouyoucos, 1962), and the results used to calculate the percentages of sand, silt and clay.The soil pH was measured in a soil-water extract (1:5 w/v) using an electric pH-meter (Model Hanna pH 211), and total soluble salts (EC in mS cm–1) were determined by conductivity meter (model 4310 JEN WAY). Sodium and potassium contents were determined by the flame photometer (Model Carl-Zeiss DR LANGE M7D). According to methods described by Jackson (1967) calcium and magnesium contents were determined volumetrically by the titration method using 0.01 N EDTA, chloride contents were volumetrically determined as AgCl, and soluble bicarbonate contents were estimated by titration.Water content of the soil samples was determined by weighing the fresh soil sample, drying it in an oven at 105 ̊ C for 24 hours, then the dry weight was determined. The water content of the sample was calculated as percent of the soil dry weight (Kapur and Govil, 2000). Contents of sulfates were estimated by turbidimetry with BaSO4, phosphate contents were determined calorimetrically as phospho-molybdate according to Woods and Mellon (1941).

Figure (1). Locations of the studied stands in the study area
Multivariate analysis was used in classification and ordination of the studied stands. For this purpose, presence/absence data matrix (63 species × 33 stands) was used. Unicates (species present in one stand) were eliminated from the data set to avoid noise and summarize redundancy. The floristic data matrix was then subjected to classification by Two-Way Indicator Species Analysis (TWINSPAN) using the default settings of the computer program CAP (Community Analysis Package, version 1.2) for Windows (Henderson and Seaby, 1999). The vegetation groups were identified on the basis of their dominant species that have the highest presence percentages (P%). The indirect gradient analysis was undertaken using Detrended Correspondence Analysis (DCA). Preliminary analyses were made by applying the default options of the DCA in the CANOCO software version 4.5 (Ter Braak, 1990) to check the magnitude of change in species composition along the first ordination axis (i.e., gradient length in standard deviation units). In the present study, DCA estimated the compositional gradient in the vegetation data to be larger than 4 S.D. units for all subset analyses, thus canonical correspondence analysis (CCA) is the appropriate ordination method to perform direct gradient analysis (Ter Braak and Prentice, 1988). The relationships between vegetation gradients and the studied environmental variables can be indicated on the ordination diagram produced by CCA biplot. A Monte Carlo permutation test (499 permutations; Ter Braak, 1990) was used to test for significance of the eigenvalues of the first canonical axis. All data variables were assessed for normality (SPSS for windows version 16.0) prior to the CCA analysis, and appropriate transformations were performed when necessary. Due to high inflation value of organic matter and chlorides, they were eliminated from CCA analysis. Therefore, 16 soil variables were included in this analysis: soil moisture content (WC), soil reaction (pH), total soluble salts (TSS), gravel, coarse sand (CS), fine sand (FS), silt, clay, sulfates (SO4), Mg, Ca, Na, HCO3, Cl, K, and PO4. Intra-set correlations were therefore used to assess the importance of the environmental variables. The TWINSPAN vegetation groups were subjected to ANOVA (One-Way Analysis of variance) based on soil variables to find out whether there were significant variations among groups. All the statistical techniques were made using SPSS version 16.0 for windows (SPSS Inc., Chicago, IL, USA).
Species diversity within each separated vegetation group was assessed using two different indices expressing species richness and diversity. Species richness (alpha-diversity; referred to as SR in the text) was calculated as the average number of species per stand, and the species diversity was calculated as the Shannon-Wiener index (Pielou, 1975) according to the following equation:
where H′ is the Shannon–Wiener diversity index, S is the total number of species, and P is the presence percentage of the ith species. The relationship between the diversity indices and the different soil variables was estimated using Spearman rank correlation coefficient.
RESULTS
Sixty-three plant species (40 perennials and 23 annuals) were recorded in study area, belonging to 58 genera from 28 different families. Five major families constituted the main bulk of the flora. The largest family was Fabaceae (7 genera and 9 species), followed by Brassicaceae (6 genera, 6 species), Asteraceae and Chenopodiaceae (5 genera, 5 species for each), and Zygophyllaceae (3 genera, 4 species). The recorded species were classified into seven different life forms according to Raunkiaer's classification. The total number of species in the different life form categories was indicated in Table (1) and displayed in Fig. (2). Therophytes (Th) were the mostly presented (22 species) life form that represents 35% of the total number of species. Most common species were Cotula cinerea, Anchusa aegyptiaca, Arnebia hispidissima, Trichodesma africanum, Polycarpaea repens and Astragalus vogelii. Chamaephytes (Ch) were represented by 20 species (32% of the recorded flora), and included Aerva javanica, Pergularia tomentosa, Pulicaria undulata, Farsetia aegyptia, Capparis spinosa and Haloxylon salicornicum. Hemicryptophytes (He) were represented by 11 species, of which Cleome arabica, Citrullus colocynthis, Lotus hebranicus, Erodium glaucophyllum, Aeluropus lagopoides, Monosonia nivea and Stipagrostis plumosa were highly represented. Eight species (12.5% of the recorded flora) represented the phanerophytes (Ph). Geophytes (G) and parasites (Par) were represented by one species for each (Juncus rigidus and Orobanche crenata, respectively).
Table 1: Floristic composition of the studied wadis showing their life span, life forms, chorotypes and presence values (P%). Abbreviations: SA = Saharo-Arabian, SU = Sudanian, SZ = Sudano-Zambezian, M = Mediterranean, IT = Irano-Turanian, Cosm = Cosmopolitan, Pan = Pantropical, Th = Therophytes, He = Hemicryptophytes, Ch = Chamaephytes, G = Geophytes, Ph = Phanerophytes, Ann = Annual, Per = Perennial. Species abbreviations (Abb) in parentheses are those displayed in Figure (3).
|
Families and species
|
Abb
|
Life
span
|
Life
forms
|
Choro-
types
|
P %
|
|
Acanthaceae
|
Blepharis edulis (Forssk.) Pers.
|
|
Per
|
He
|
SA
|
22.2
|
|
Aizoaceae
|
Aizoon canariense L.
|
|
Ann
|
Th
|
SZ
|
11.1
|
|
Amaranthaceae
|
Aerva javanica (Burm.f.) Juss. Ex Schult.
|
|
Per
|
Ch
|
SA
|
2.80
|
|
Apocynaceae
|
Leptadenia pyrotechnica (Forssk.) Decne.
|
|
Per
|
Ph
|
SA
|
2.80
|
|
Pergularia tomentosa L.
|
|
Per
|
Ch
|
SA
|
11.1
|
|
Asteraceae
|
Cotula cinerea Kotschy ex Benth. & Hook.
|
|
Ann
|
Th
|
SA
|
11.1
|
|
Ifloga spicata (Forssk.) Sch. Bip.
|
|
Ann
|
Th
|
M+SA+IT
|
13.9
|
|
Pulicaria undulata (L.) C.A. Mey.
|
|
Per
|
Ch
|
SA
|
44.5
|
|
Reichardia tingitana (L.) Roth
|
|
Ann
|
Th
|
M+SA+IT
|
5.60
|
|
Senecio flavus (Decne.) Sch. Bip.
|
|
Ann
|
Th
|
SA
|
8.30
|
|
Boraginaceae
|
Anchusa aegyptiaca (L.) A. DC.
|
|
Ann
|
Th
|
M+SA+IT
|
16.7
|
|
Arnebia hispidissima (Lehm.) A. DC.
|
A. his
|
Ann
|
Th
|
SA
|
16.7
|
|
Trichodesma africanum (L.) Sm.
|
|
Ann
|
Th
|
SA+SZ
|
61.1
|
|
Brassicaceae
|
Eremobium aegyptiacum (Spreng.)
Asch. & Schweinf. ex Boiss.
|
|
Ann
|
Th
|
SA
|
8.30
|
|
Farsetia aegyptia Turra
|
F. aeg
|
Per
|
Ch
|
SA
|
13.9
|
|
Zilla spinosa (L.) Prantl
|
|
Per
|
Ch
|
SA
|
61.1
|
|
Lobularia arabica (Boiss.) Muschl.
|
|
Ann
|
Th
|
SA
|
19.4
|
|
Morettia philaeana (Delile) DC.
|
M. ph
|
Per
|
Ch
|
SA
|
50.0
|
|
Moricandia sinaica (Boiss.) Boiss.
|
|
Per
|
Ch
|
SA
|
8.30
|
|
Capparaceae
|
Capparis spinosa L.
|
|
Per
|
Ch
|
M+SA+IT
|
2.80
|
|
Caryophyllaceae
|
Gypsophila capillaries (Forssk.) C.Chr.
|
|
Per
|
Ch
|
M+SA
|
5.60
|
|
Polycarpaea repens (Forssk.) Asch. & Schweinf.
|
|
Ann
|
Th
|
SA
|
24.0
|
|
Pteranthus dichotomus Forssk.
|
P. dic
|
Ann
|
Th
|
SA
|
18.0
|
|
Chenopodiaceae
|
Anabasis articulata (Forssk.) Moq.
|
|
Per
|
Ch
|
SA+IT
|
13.9
|
|
Arthrocnemum macrostachyum (Moric.) K. Koch
|
|
Per
|
Ch
|
M+SA
|
2.80
|
|
Cornulaca monacantha Delile
|
|
Per
|
Ch
|
SA
|
27.8
|
|
Haloxylon salicornicum (Moq.) Bunge ex Boiss.
|
H. sal
|
Per
|
Ch
|
SA+IT
|
8.30
|
|
Salsola imbricata Forssk.
|
|
Per
|
Ch
|
SA
|
2.80
|
|
Cleomaceae
|
Cleome arabica L.
|
|
Per
|
He
|
SA
|
8.30
|
|
Cleome droserifolia (Forssk.) Delile
|
|
Per
|
He
|
SA
|
2.80
|
|
Cucurbitaceae
|
Citrullus colocynthis (L.) Schrad.
|
|
Per
|
He
|
M+SA+IT
|
8.30
|
|
Euphorbiaceae
|
Chrozophora oblongifolia (Delile) Spreng.
|
|
Per
|
Ch
|
M+SA
|
11.1
|
|
Fabaceae
|
Acacia tortilis (Forssk.) Hayne subsp. raddiana
(Savi) Brenan
|
A. rad
|
Per
|
Ph
|
SA+SZ
|
30.6
|
|
Astragalus hamosus L.
|
|
Ann
|
Th
|
M
|
41.7
|
|
Astragalus sieberi DC.
|
|
Per
|
Ch
|
SA
|
5.60
|
|
Astragalus vogelii (Webb) Bornm.
|
A. vog
|
Ann
|
Th
|
SA
|
33.3
|
|
Crotalaria aegyptiaca Benth.
|
|
Per
|
He
|
SA
|
2.80
|
|
Lotononis platycarpos (Viv.) Pichi-Serm.
|
|
Ann
|
Th
|
SZ
|
13.9
|
|
Lotus hebranicus Hochst. ex Brand
|
L. heb
|
Per
|
He
|
M
|
44.4
|
|
Retama raetam (Forssk.) Webb & Berthel.
|
R. rae
|
Per
|
Ph
|
SA
|
5.60
|
|
Senna italica Mill.
|
|
Per
|
Ch
|
SZ
|
30.3
|
|
Geraniaceae
|
Erodium glaucophyllum (L.) L'Hér.
|
|
Per
|
He
|
SA
|
33.3
|
|
Monosonia nivea (Decne.) Webb
|
M. niv
|
Per
|
He
|
SA
|
52.8
|
|
Juncaceae
|
Juncus rigidus Desf.
|
|
Per
|
G
|
M+SA+IT
|
5.60
|
|
Liliaceae
|
Asphodelus tenuifolius Cav.
|
|
Ann
|
Th
|
M+SA+IT
|
25.0
|
|
Moringaceae
|
Moringa peregrina (Forssk.) Fiori
|
|
Per
|
Ph
|
SZ
|
5.60
|
|
Nitrariaceae
|
Nitraria retusa (Forssk.) Asch.
|
N. ret
|
Per
|
Ph
|
SA
|
4.00
|
|
Orobanchaceae
|
Orobanche crenata Forssk.
|
|
Ann
|
Parasite
|
M+SA+IT
|
2.80
|
|
Plantaginaceae
|
Plantago ovata Forssk.
|
|
Ann
|
Th
|
M+SA+IT
|
5.60
|
|
Plantago phaeostoma Boiss. & Heldr.
|
|
Ann
|
Th
|
SA
|
19.4
|
|
Poaceae
|
Aeluropus lagopoides (L.) Trin. ex Thwaites
|
|
Per
|
He
|
M+SA+IT
|
8.30
|
|
Stipagrostis plumosa (L.) Munro ex T. Anderson
|
|
Per
|
He
|
M+SA+IT
|
18.0
|
|
Polygonaceae
|
Calligonum polygonoides L.
|
|
Per
|
Ch
|
M+SA
|
2.80
|
|
Rumex vesicarius L.
|
|
Ann
|
Th
|
SA+IT
|
13.9
|
|
Resedaceae
|
Ochradenus baccatus Delile
|
|
Per
|
Ph
|
SA
|
19.4
|
|
Reseda alba L.
|
|
Ann
|
Th
|
M+IT
|
27.8
|
|
Salvadoraceae
|
Salvadora persica L.
|
|
Per
|
Ph
|
SA
|
2.80
|
|
Tamaricaceae
|
Tamarix nilotica (Ehrenb.) Bunge
|
T. nil
|
Per
|
Ph
|
SA+IT
|
11.1
|
|
Urticaceae
|
Forsskaolea tenacissima L.
|
F. ten
|
Per
|
He
|
SA+SZ
|
22.8
|
|
Zygophyllaceae
|
Fagonia indica L.
|
F. ind
|
Per
|
Ch
|
SA
|
33.3
|
|
Tribulus pentandrus Forssk.
|
|
Ann
|
Th
|
SA+SZ
|
27.8
|
|
Zygophyllum coccineum L.
|
|
Per
|
Ch
|
SA
|
75.0
|
|
Zygophyllumsimplex L.
|
Z. sim
|
Ann
|
Th
|
SA
|
41.7
|

Figure (2). Chorotype spectrum and species life forms diagram. M (%) = species magnitude and average group abundance. For abbreviations, see Table (1).
The recorded species were classified according to their chorological affinities (Table 1). Thirty-three species (52.45%) were pure (mono-regional) Saharo-Arabian focus of distribution (e.g., Blepharis edulis, Aerva javanica, Leptadenia pyrotechnica, Cotula cinerea, Pulicaria undulata, Arnebia hispidissima, Eremobium aegyptiacum and Farsetia aegyptia). When penetrating to other regions, 4 species were with the Sudano-Zambezian (Trichodesma africanum, Acacia tortilis, Forsskaolea tenacissima and Tribulus pentandrus, 4 species were with the Irano-Turanian (Anabasis articulata, Haloxylon salicornicum, Rumex vesicarius and Tamarix nilotica), and 4 species were with the Mediterranian (Gypsophila capillaris, Arthrocnemum macrostachyum, Chrozophora oblongifolia and Calligonum polygonoides. Eleven species (17.5% of the recorded species) showed wide geographical range of distribution, mainly Saharo-Arabian penetrating to either Mediterranean or Irano-Turanian regions. These included, amongst others: Reichardia tingitana, Anchusa aegyptiaca, Juncus rigidus, Asphodelus tenuifolius and Aeluropus lagopoides. Two species: Lotus hebranicusand Astragalus hamosuswere recorded as pure (mono-regional) Mediterranian species (3.2% of the recorded flora). Mediterranean species that penetrated to the Irano-Turanian region were represented by one species (Reseda alba). Four species (6.3%) included Aizoon canariense, Lotononis platycarpos, Senna italica and Moringaperegrina represented the typical (mono-regional) Sudano-Zambezian species.
The TWINSPAN analysis divided the 33 stands into five vegetation groups, each group representing a specific plant community according to the most abundant characteristic species that reached the highest presence percentages (Fig. 3). Zilla spinosa, Zygophyllum coccineum, Z. simplex and Trichodesma africanum was recorded with variable presence values in the five groups. Group A comprised of 20 species recorded from 3 stands, with species richness of 12.33± 4.04 species stands-1, and Shannon-Wiener diversity index of 2.48±0.31 (Table 2). Stands of this group inhabited soil rich in its bicarbonates and the lowest levels of Ca and pH. Zygophyllum simplex, Fagonia indica, Lotononis platycarpa, Morettia philaeana, Forsskaolea tenacissima and Arnebia hispidissima represented the dominant species. Aerva javanica and Convovulus austro-aegyptiacus were confined to this group. Group B comprised of 28 species recorded from 3 stands, with the highest species richness amongst the other groups (18.00±1.00 species stands-1), and Shannon-Wiener diversity index of 2.89±0.06 (Table 2). Soil contents of phosphates, pH, fine sand and coarse sand were the highest amongst the others. Trichodesma africanum, Zilla spinosa, Zygophyllum simplex, Fagonia indica, Lotus hebranicus, Reseda alba, Pulicaria undulata, Ifloga spicata, Arnebia hispidissima, and Aizoon canariense were the dominant species (P=100%). Fivespecies showed consistency to this group: Aizoon canariense, Gypsophila capillaris, Moringa peregrina, Capparis aegyptia and Leptadenia pyrotechnica.Group C comprised of 28 species from 7 stands, with the lowest species richness of 10.43±4.58 species stands-1, and Shannon-Wiener diversity index of 2.25±0.49 (Table 2). Soil contents of magnesium and gravels had the highest values amongst the others. The lowest soil contents of phosphates and bicarbonates characterized this group. This community had three characteristic species (P=86%): Zygophyllum coccineum, Acacia tortilis subsp. raddiana and Morettia philaeana. Four consistent species to this group were Pergularia tomentosa, Calligonum polygonoides, Cleome droserifolia and Salvadora persica. Group D (27 species from 7 stands) resembled group C in its soil composition with the lowest species richness (10.43±3.74 species stands-1 and Shannon-Wiener diversity index (2.29±0.35). The soil of this group of stands characterized by the highest Na, TSS and water contents. The dominant species P=100%) were Zygophyllum coccineum and Morettia philaeana. Consistent species to this group were Arthrocenemum macrostachyum, Orobanche crenata and Salsola imbricata subsp. imbricata.Group E (13 stands and 40 species) with an average species richness of 13.69±4.75 species stands-1, and Shannon-Wiener diversity index of 2.54±0.47. The two dominant species Monsonia nivea and Astragalus hamosus were represented by presence value (92%). Fifteen species of the recorded flora in the study area were confined to this vegetation group and included Haloxylon salicornicum, Pteranthus dichotomus, Nitraria retusa, Farsetia aegyptia, Tamarix nilotica, Retama raetam and Plantago ovata.
Application of Detrended Correspondence Analysis (DCA) to the vegetation data of the studied wadis (Fig. 4) revealed the segregation of the 5 vegetation groups along DCA axis 1 (Eigenvalue 0.646) and DCA axis 2 (Eigenvalue 0.338). The cumulative percentage variance of species data of the first two DCA axes was 32.8%. Stands of vegetation groups B and E were clearly separated in the ordination plane, while those of groups A, C and D showed some interference.
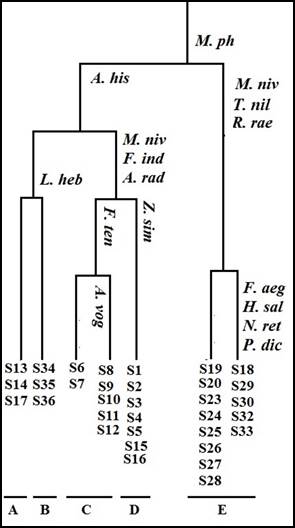
Figure (3).TWINSPAN vegetation groups (A-E), with their indicator species. For species abbreviations, see Table (1).
Table 2: Mean values, standard deviations (STD) and ANOVA values of the soil variables in the vegetation groups (A-E). N= number of stands, * = p< 0.05, ** = p < 0.01.
|
Soil Variables
|
Vegetation groups
|
p-value
|
|
A (N = 3)
|
B (N = 3)
|
C (N = 7)
|
D (N = 7)
|
E (N = 13)
|
|
Chemical properties
|
|
 pH pH
|
7.48
|
±
|
0.08
|
7.70
|
±
|
0.00
|
7.56
|
±
|
0.09
|
7.55
|
±
|
0.06
|
7.57
|
±
|
0.14
|
0.144
|
|
Na
|
77.95
|
±
|
16.98
|
28.89
|
±
|
8.39
|
92.57
|
±
|
24.19
|
100.07
|
±
|
69.65
|
54.36
|
±
|
16.60
|
0.02*
|
|
K
|
30.05
|
±
|
6.67
|
27.61
|
±
|
5.48
|
33.38
|
±
|
13.97
|
31.34
|
±
|
20.65
|
16.12
|
±
|
8.41
|
0.045*
|
|
Ca (mg.g-1 d.wt. soil)
|
0.14
|
±
|
0.01
|
0.21
|
±
|
0.02
|
0.17
|
±
|
0.01
|
0.19
|
±
|
0.06
|
0.24
|
±
|
0.08
|
0.042*
|
|
Mg
|
0.30
|
±
|
0.01
|
0.28
|
±
|
0.02
|
0.32
|
±
|
0.08
|
0.31
|
±
|
0.06
|
0.29
|
±
|
0.09
|
0.814
|
|
Cl
|
0.55
|
±
|
0.02
|
1.61
|
±
|
2.12
|
0.50
|
±
|
0.12
|
0.53
|
±
|
0.17
|
0.46
|
±
|
0.09
|
0.049*
|
|
HCO3
|
2.23
|
±
|
0.06
|
2.20
|
±
|
0.10
|
2.08
|
±
|
0.47
|
2.11
|
±
|
0.35
|
2.19
|
±
|
0.29
|
0.925
|
|
PO4
|
2.09
|
±
|
0.26
|
2.32
|
±
|
0.15
|
1.78
|
±
|
0.33
|
1.89
|
±
|
0.36
|
2.13
|
±
|
0.16
|
0.018*
|
|
Water content (WC) (%)
|
0.48
|
±
|
0.12
|
0.59
|
±
|
0.25
|
0.43
|
±
|
0.26
|
0.89
|
±
|
0.76
|
0.36
|
±
|
0.15
|
0.088
|
|
Total soluble salts (TSS) (mS cm–1)
|
0.73
|
±
|
0.19
|
0.57
|
±
|
0.05
|
0.82
|
±
|
0.19
|
0.96
|
±
|
0.63
|
0.84
|
±
|
0.63
|
0.86
|
|
SO4 (µg.g-1 d.wt. soil)
|
0.31
|
±
|
0.10
|
0.08
|
±
|
0.05
|
0.28
|
±
|
0.16
|
0.19
|
±
|
0.07
|
0.49
|
±
|
0.66
|
0.501
|
|
Physical properties
|
|
 Gravel Gravel
|
28.53
|
±
|
2.40
|
25.87
|
±
|
2.90
|
29.70
|
±
|
5.02
|
27.16
|
±
|
8.28
|
21.70
|
±
|
7.67
|
0.132
|
|
Coarse sand (CS)
|
33.27
|
±
|
18.87
|
46.83
|
±
|
6.43
|
25.64
|
±
|
7.04
|
24.63
|
±
|
7.59
|
23.25
|
±
|
9.44
|
0.008**
|
|
Fine sand (FS) (%)
|
11.07
|
±
|
4.98
|
9.80
|
±
|
2.95
|
12.47
|
±
|
2.70
|
12.96
|
±
|
4.61
|
10.95
|
±
|
4.22
|
0.715
|
|
Silt
|
18.77
|
±
|
9.58
|
11.07
|
±
|
3.56
|
23.66
|
±
|
7.70
|
26.09
|
±
|
6.78
|
32.87
|
±
|
10.95
|
0.006**
|
|
Clay
|
8.37
|
±
|
4.56
|
6.43
|
±
|
4.91
|
8.53
|
±
|
2.23
|
9.17
|
±
|
2.61
|
11.22
|
±
|
6.26
|
0.49
|
|
Diversity indices
|
|
Species richness (SR)
|
12.33
|
±
|
4.04
|
18.00
|
±
|
1.00
|
10.43
|
±
|
4.58
|
10.43
|
±
|
3.74
|
13.69
|
±
|
4.75
|
0.08
|
|
Shannon-Wiener index (H')
|
2.48
|
±
|
0.31
|
2.89
|
±
|
0.06
|
2.25
|
±
|
0.49
|
2.29
|
±
|
0.35
|
2.54
|
±
|
0.47
|
0.22
|
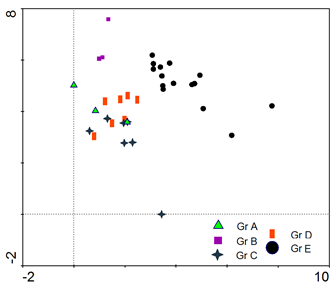
Figure (4). Detrended Correspondence Analysis (DCA) ordination of the 33 stands on DCA axes 1 and 2 as classified by TWINSPAN, showing the 5 vegetation groups (Gr A-E).
Significant differences in the examined soil variables within the separated vegetation groups were demonstrated in Table (2). Soil contents of Na, K, Ca, PO4, coarse sand and silt showed clear significant differences between groups.
The relationship between the vegetation and soil variables was studied using Canonical Correspondence Analysis (CCA). Figure (5) showed the CCA ordination biplot with vegetation groups (A-E), and the examined soil variables. It can be noted that, stands of group A and C were highly correlated with Na, K, fine sand and gravel, while those of group B showed a correlation with pH and clay. Meanwhile, stands of group D showed a correlation to WC and soil fractions (except silt). Stands of group E correlated to the soil SO4, Ca and bicarbonates.
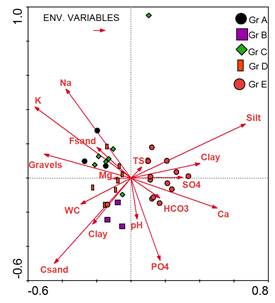
Figure (5). Canonical correspondence analysis (CCA) biplot of axes 1 and 2 showing the distribution of the 33 stands, together with their vegetation groups (Gr A-E) and soil variables.
The intra-set correlations resulted from Canonical Correspondence Analysis (CCA) of the examined soil variables were displayed in Table 3). Of the 16 examined soil factors, Na, K, Ca, PO4, gravels, coarse sand, silt and clay showed significance differences along the first two CCA axes. CCA axis 1 was highly positively correlated with silt and highly negatively correlated with K. This axis can be interpreted as Silt-K gradient. CCA axis 2 was highly positively correlated with Na and highly negatively with coarse sand (CS). Thus, this axis can be interpreted as Na-CS gradient.A test for significance with an unrestricted Monte Carlo permutation test (499 permutation) for the eigenvalue of axis 1 found to be significant (P = 0.002), indicating that the observed patterns did not arise by chance.
Table 3:Inter–set correlation of CCA analysis for the soil variables, together with eigenvalues and species–environment correlations. For soil units, see Table (3). * = significant at p = 0.05, ** = significant at p = 0.01.
|
Soil variables
|
CCA
Axis 1
|
CCA
Axis 2
|
|
Eigenvalues
|
0.466
|
0.273
|
|
Species–environment
correlations
|
0.917
|
0.928
|
|
Na
|
-0.378
|
0.520**
|
|
K
|
-0.561**
|
0.416*
|
|
Ca
|
0.501**
|
-0.176
|
|
Mg
|
-0.105
|
-0.002
|
|
PO4
|
0.170
|
-0.482*
|
|
SO4
|
0.299
|
0.003
|
|
HCO3
|
0.169
|
-0.116
|
|
Cl
|
-0.223
|
-0.270
|
|
pH
|
0.036
|
-0.240
|
|
Total soluble salts (TSS)
|
0.064
|
0.064
|
|
Water content (WC)
|
-0.292
|
-0.153
|
|
Gravels
|
-0.505**
|
0.140
|
|
Coarse sand (CS)
|
-0.446*
|
-0.499*
|
|
Fine sand (FS)
|
-0.198
|
0.180
|
|
Silt
|
0.668**
|
0.320
|
|
Clay
|
0.403*
|
0.085
|
DISCUSSION
As in other hyper-arid regions of the world, the vegetation in the study area is restricted to wadis, runnels and depressions with deep fine sediments that receive adequate water supply. Minimal precipitation and frequent droughts characterized the vegetation in the arid regions; therefore, availability of water is one of the primary factors controlling the distribution of species (Marcelo et al., 2015). The plant life in the study area is restricted to microenvironments (as in wadis, runnels and depressions), where runoff water collects and provides sufficient moisture for plant growth which is mainly formed of xerophytic shrubs and sub-shrubs to withstand the harsh environmental conditions (Salama et al., 2016).
The vegetation structure is relatively simple, in whichthe species have to withstand the harsh environmentalconditions which can be reflected by the presence of severalhighly adapted, drought-resistant and salt-tolerant species such as Acaciatortilis subsp. raddiana, Capparis spinosa, Zygophyllumcoccineum, Zilla spinosa, Salvadora persica,Aeluropus lagopoides and Tamarix nilotica.
In the present study, Asteraceae, Zygophyllaceae, Fabaceae, Chenopodiaceae and Brassicaceae were the species-rich families, and represent the most common in the Mediterranean North African flora. On the other hand, Poaceae, Fabaceae, Asteraceae and Brassicaceae constituted the main bulk of floristic composition of different habitats in Egypt (Salama et al., 2018), and in adjacent countries such as Libya (Feng et al., 2013), and were found to be the most frequent families in the tropics (Tamado and Milberg, 2000).
The chorological analysis of the surveyed flora revealed that 39 species (61.6% of the total flora) were monoregional, of which 33 species (52.4%) are native to the Saharo-Arabian chorotype. The Sudano-Zambezian chorotype ranked second, of which 38.1% of the recorded species are biregional and pluri-regional, extending their distribution all over the Saharo-Arabian, Sudano-Zambezian, Irano-Turanian and Mediterranean regions. The increase in the numbers of the Saharo-Arabian species in the studied area can be attributed to their high tolerability to desert environmental conditions, and in the mean time, good indicators for hot and dry climate.
The highest among other perennial species were Zilla spinosa and Zygophyllum coccineum (P=61.1% and 75%, respectively) in the studied stands, and spread their dominancy all over the Eastern Desert of Egypt (Abd El-Ghani et al., 2014). Their dominance over the communities of the Eastern Desert was documented by many scholars (Galal and Fahmy, 2012). This study revealed the presence of some species that characterized the salinized lands, and are considered among the halophytic vegetation along the Red Sea coast: Niraria retusa, Tamarix nilotica, Arthrocnemum macrostachyum, Juncus rigidus, Aeluropus lagopoides. Such hillock-forming salt-tolerant species were recorded in relevant studies on the flora and vegetation along the Red Sea coasts either in Egypt (Shaltout et al., 2009) or in Saudi Arabia (Al-Gifri et al., 2019). Tamarix nilotica is vigorously growing southwards, and represents the natural climax community type of the Red Sea coastal plain with deep deposits and an underground water reserve. The growth of the desert scrub Nitraria retusa represents the highest tolerance to soil salinity conditions and a penultimate stage in the successional development. Such an effect of salinity stress on floristic diversity in the study area and related areas was reported by Moustafa and Klopatek (1995) in Sinai desert, and Moreno et al. (2017) in the Iberian Peninsula.
Dataset classification of the recorded species using the TWINSPAN analysis yielded 5 separated vegetation groups. As usual in the Eastern desert, Zilla spinosa, Zygophyllum coccineum, Z. simplex and Trichodesma africanum were covered all-over the study area. These species are widely distributed in Egypt (Zahran and Willis, 2009) and neighboring. In this investigation, most stands of groups E and B were located in the Southern part of the study area (Wadi El-Mallaha and Wadi Beli), while the site conditions of the Northern part (Wadi Dib and Wadi Abu Had) were more suitable for the species of the remaining groups (A, C and D). A recent comparable study (El-Khouly and Shawky, 2017) on the species diversity and vegetation analysis of Wadi El-Mallah and W. Esli, recognized 6 vegetation groups. Apart from Capparis decidua, which was not recorded in this investigation, both studies revealed almost similar groups.
Salinity seems to be the key factor in this study area; stands of group A; that characterized by high soil contents of sodium ions; were dominated by many annuals (i.e. Zygophyllum simplex, Forsskaolea tenacissima and Arnebia hispidissima). Meanwhile, the decrease of species diversity and dominance of many perennials (i.e. Zygophyllum coccineum, Acacia tortilis subsp. raddiana and Ochradenus baccatus) and some xerophytic annuals (i.e. Polycarpaea repensTrichodesma africanum) in group C may due to the decrease of soil phosphates. This significant positive correlation between soil phosphorus and species diversity was noted by Henkin et al. (2006) on annual legumes of Israel. The same trend was observed in stands of group D that characterized by the highest Na, TSS and water contents. Also, dominance of some salt-tolerant species such as Arthrocenemum macrostachyum, and Salsola imbricata subsp. imbricata revealed the salinity of these soils.
Special microhabitat was observed in Wadi El-Mallaha (group E). It is an inland depression (20 km long and 5 km wide) separated from the shore-line by an elevated raised beach and is fed with seawater through underground seepage. The bottom of the depression includes several small salt-water lagoons, fringed by extensive saline ground covered by surface crusts. This is, in turn, fringed by salt marsh vegetation. This describes the restriction of some halophytes as Haloxylon salicornicum, Nitraria retusa, Tamarix nilotica, Retama raetam, Juncus rigidus and Aeluropus lagopoides. Long-term aridity may also cause the accumulation of the salt content of such depressions, and cyclic drought periods accelerate the salinization process (Akhani, 2006).
The relationships between plant communities and environmental factors have become increasingly important to understanding the ecology of arid areas (Zhang et al., 2005). In the extreme arid conditions of the Atacama Desert (Chile); one of the driest world's deserts; Ruhm et al. (2020) investigated the spatial patterns of floristic diversity and composition around the hyperarid core of this desert in 21 localities from the coastal and Andean deserts in northern Chile, and indicated a drastic east-west divergence in floristic similarity which has been explained on the basis of biotic barriers prevented plant exchange from east to west. Meanwhile, Li et al. (2004) portrayed the association between vegetation patterns and soil properties in the southeastern Tengger Desert of China, and concluded that soil moisture, texture, and nutrient were highly correlated with the structure and pattern of vegetation. In this study, Canonical Correspondence Analysis (CCA) revealed the importance of Na, K, Ca, PO4, gravels, coarse sand, silt and clay in species distribution patterns. El-Khouly and Shawky (2017) reached to the same result in their study on W. El-Mallaha and W. Esli. Both ordination techniques clearly indicated that salinity, fine sediments and moisture content were the important factors controlling the distribution of the vegetation in the study area. This has been reported by other researchers in Saudi Arabia (Shaltout et al., 1997), and in the Gurbantunggut Desert of China (Qian et al., 2008).
REFERENCES
- Abd El-Ghani, M.M. and N. El-Sawaf (2005). The coastal roadside vegetation and environmental gradients in the arid lands of Egypt. Community Ecol. 6(2): 143-154.
- Abd El-Ghani, M.M. and W. Amer (2003). Soil-vegetation relationships in a coastal desert plain of southern Sinai, Egypt. J. Arid Environ. 55: 607-628.
- Abd El-Ghani, M.M., F.M. Huerta-Martínez, L. Hongyan and R. Qureshi (2017). Plant Responses to Hyperarid Desert Environments. Springer.
- bd El-Ghani, M.M., F.M. Salama, B. Salem, A. El-Hadidy and M. Abdel-Aleem (2014). Biogeographical relations of a hyperarid desert flora in eastern Egypt. Afr. J. Ecol.52 (2): 173-191.
- Akhani, H. (2006). Biodiversity of halophytic and sabkha ecosystems in Iran. In: Ajmal Khan M, Benno B, Kust GS Barth H: (eds.), Sabkha Ecosystems. Volume II: West and Central Asia, pp. 71-88. Springer.
- Al-Gifri, A.N., W.T. Kasem, R.S. Shehata and M.M. Eldemerdash (2019). The African Paleotropical Influence on the Biogeography of the Flora of Jazan, KSA. Asian J. Soil Sci. Plant Nutr. 4(1): 1-10.
- Boulos, L. (1995). Flora of Egypt, Checklist. Al Hadara Publishing, Cairo, Egypt, 283 pp.
- Boulos, L. (1999). Flora of Egypt, Vol. 1: Azollaceae – Oxalidaceae: Al Hadara Publisher, Cairo, 419pp.
- Boulos, L. (2000). Flora of Egypt, Vol. 2: Geraniaceae – Boraginaceae: Al Hadara Publisher, Cairo, 352 pp.
- Bouyoucos, G.J. 1962. Hydrometer method im-proved for making particle size analysis of soils. Agr. J. 54: 464-465.
- El-Khouly, A. and R. Shawky (2017). Plant species diversity of some wadis at Red Sea Coast, Egypt. Research & Reviews: J. Bot. Sci. 6 (2): 25-35.
- Feng, Y., J. Qiang, X. Xing-Wen and P. Bo-Rong (2013). Composition and characteristics of Libyan flora. Arch. Biol. Sci.(Belgrade) 65 (2): 651-657.
- Flores, J. and O. Briones (2001). Plant life-form and germination in a Mexican inter-tropical desert: effects of soil water potential and temperature. J. Arid Env. 47(4): 485-497.
- Galal, T.M. and A.G. Fahmy (2012). Plant diversity and community structure of Wadi Gimal protected area, Red Sea Coast of Egypt. Afr. J. Ecol. 50: 266–276.
- Hahs, A., N.J. Enright and I. Thomas (1999). Plant communities, species richness and their environmental correlates in the sandy heaths of Little Desert National Park, Victoria. Austral. Ecol. 24(3): 249-257.
- Henderson, P.A. and R.M.H. Seaby (1999). Community Analysis Package (CAP) version 1.2. Pisces Conservation Ltd. IRC House, UK.
- Henkin, Z., M. Sternberg, N.G. Seligman, I. Noy-Meir (2006). Species richness in relation to phosphorus and competition in a Mediterranean dwarf-shrub community. Agric. Ecosyst. Environ. 113: 277–283.
- Huerta-Martínez, F.M., J.A. Vázquez-García, E. García-Moya, L. López-Mata and H. Vaquera-Huerta (2004). Vegetation ordination at the southern Chihuahuan Desert (San Luis Potosi, Mexico). Plant Ecol. 174: 79–87.
- Jackson, M.L. (1967). Soil Chemical Analysis. Prentice-Hall of India, Private limited New Delhi., 498pp.
- Kapur, P. and S.R. Govil (2000). Experimental plant ecology. CBS, Publisher and Distributors, Darya ganj, New Delhi (India).
- Li, X.R., Z.S. Zhang, J.G. Zhang, X.P. Wang and X.H. Jia (2004). Association between Vegetation Patterns and Soil Properties in the Southeastern Tengger Desert, China. Arid Land Res. Manag. 18: 369–383.
- Lundholm, J.T. and D.W. Larson (2003). Relationships between spatial environmental heterogeneity and plant species diversity on a limestone pavement. Ecography 26 (6): 715–722.
- Maestre, F.T., S. Bautista and J. Cortina (2003). Positive, negative, and net effects in grass‐shrub interactions in Mediterranean semiarid grasslands. Ecology 84: 3186–3197.
- Marcelo, F.M., A.S. Igor, S.A. Francisca, N.L. Eimear, R.M. Thomas and R.M. Fernando (2015). The Role of Edaphic Environment and Climate in Structuring Phylogenetic Pattern in Seasonally Dry Tropical Plant Communities. PLoS One 10(3): e0119166.
- Moreno, A. C. Pérez-Mejías, M. Bartolomé et al. (2017). New speleothem data from Molinos and Ejulve caves reveal Holocene hydrological variability in northeast Iberia. Quat. Res. 88: 223-233.
- Moustafa, A.A. and J.M. Klopatek (1995). Vegetation and landforms of the Saint Catherine area, southern Sinai, Egypt. J. Arid Environ. 30: 385-395.
- Pan, D., A. Bouchard, P. Legendre and G. Domon (1998). Influence of edaphic factors on the spatial structure of inland halophytic communities: a case study in China. J. Veg. Sci. 9: 797-804.
- Pielou, E.C. (1975). Ecological Diversity. New York: Wiley, 165 pp.
- Qian, Y., Z. Wu, R. Zhao and L. Zhang (2008). Vegetation patterns and species-environment relationships in the Gurbantunggut Desert of China. J. Geog. Sci. 18(4): 400–414.
- Raunkiaer, C. (1937). The Life Forms of Plants and Statistical Plant Geography. Clarendon Press, Oxford, 104 pp.
- Ruhm, J., T. Böhnert, M. Weigend, F. F. Merklinger, A. Stoll, D. Quandt and F. Luebert (2020). Plant life at the dry limit—Spatial patterns of floristic diversity and composition around the hyperarid core of the Atacama Desert. PLoS ONE 15(5): e0233729. https://doi.org/10.1371/journal. pone.0233729
- Salama, F., M. Ahmed, N. El-Tayeh and S. Hammad (2012). Vegetation analysis, phenological patterns and chorological affinities in Wadi Qena, Eastern Desert, Egypt. Afr. J. Ecol. 50(2): 193-204.
- Salama, F.M., M.M. Abd El-Ghani, M. Gadallah, S. El-Naggar and A. Amro (2014). Variations in vegetation structure, species dominance and plant communities in south of the Eastern Desert-Egypt. Not. Sci. Biol., 6(1): 41-58.
- Salama, F.M., M.M. Abd El-Ghani, M.A. Gadallah, S.M. El-Naggar and A. Amro (2015). Diversity and responses of plant functional groups to soil variables in the arid desert landscape of southern Egypt. JBES 5 (1): 24-39.
- Salama, F.M., M.M. Abd El-Ghani, M.A. Gadallah, S.M. El-Naggar and A. Amro (2016). Characteristics of desert vegetation along four transects in the arid environment of southern Egypt. Turk. J. Bot. 40: 59-73.
- Salama, F.M., M.M. Abd El-Ghani, M. Gadallah, T. Ramadan, H.K. Galal and A. Gaafar (2018). Vegetation patterns and floristic composition along elevation gradient on Jabal Musa, South Sinai, Egypt. Catrina 17 (1): 41-57.
- Shaltout, K.H., M.G. Sheded and A.H. Salem (2009). Population structure of common shrubs and trees in Wadi Allaqi Biosphere Reserve, South-East Egypt. Feddes Repert.120 (5–6): 343–354.
- Shaltout, K.H., E.F. El-Halawany and M.M. El-Garawany (1997). Coastal lowland vegetation of eastern Saudi Arabia. Biodivers. Conserv. 6: 1027-1070.
Täckholm, V. (1974). Students' Flora of Egypt, 2nd Ed. Cairo University Press, Cairo, Egypt, 888 pp.
- Tamado, T. and P. Milberg (2000). Weed flora in arable fields of eastern Ethiopia, with emphasis on the occurrence of Parthenium hysterophorus. Weed Research 40: 507-521.
- Ter Braak, C.J.F. (1990). Update notes: CANOCO version 3.1. Wageningen, Agricultural Mathematics Group.
- Ter Braak, C.J.F. and I.C. Prentice (1988). A theory of gradient analysis. Adv. Ecol. Res. 18: 271-317.
- Tizro A.T. and K.S. Voudouris (2007). Groundwater quality in the semi-arid region of the Chahardouly basin, West Iran. Hydrol. Process. DOI: 10.1002/hyp.6893.
- Woods J.T. and M.A. Mellon (1941). Chlorostannous-Molybdophosphoric blue colour method in sulfuric acid system. In soil chemical analysis by Jackson ML (1958). Prentice Hall International. Inc. London.
- Xu, L.-H., H.-Y. Liu, X.-Z. Chu and K. Su (2006). Desert vegetation patterns at the northern foot of Tianshan Mountains: The role of soil conditions. Flora 206 (1): 44-50.
- Zahran, M.A. and A.J. Willis (2009). The Vegetation of Egypt. London. Volume 2: Plant and Vegetation. Springer Science and Business Media B.V.
- Zhang, Y.M., Y.N. Chen and B.R. Pan (2005). Distribution and floristics of desert plant communities in the lower reaches of Tarim River, southern Xinjiang, People’s Republic of China. J. Arid Environ. 63: 772–784.
- Zohary, M. (1966). Flora Palaestina. Part I. The Israel Academy of Sciences of Humanities.
- Zohary, M. (1972). Flora Palaestina. Part II. The Israel Academy of Science and Humanities.
|


