DETERMINATION OF GENETIC DIVERSITY IN SOME LOCAL ALFALFA (Medicago sativa L.) ECOTYPES USING SSR MARKERS
M. M. Ertus1 and S. Sensoy2
1 Hakkari University, Colemerik Vocational School, Department of Plant and Animal Production, Turkey
2 Van Yuzuncu Yil University, Faculty of Agriculture, Department of Horticulture, Turkey
*Corresponding author’s E-mail: macitertus@gmail.com
ABSTRACT
In this study, the genetic diversity and relationships were examined by using SSR markers among six local alfalfa (Medicago sativa L.) ecotypes grown in Eastern Anatolian Region of Turkey. Eleven SSR primers produced 111 polymorphic bands in 90 alfalfa genotypes (15 genotypes from each ecotypes). The maximum (15) and minimum (5) allele numbers were obtained from the primers AFcat32 and AFct11, respectively. The polymorphism rate among the ecotypes ranged from 54.55% to 74.03%. According to the similarity coefficient matrix used to determine the degree of relationship, the closest similarity (0.68) was determined between the ecotypes Catak and Ercis, but the most distant one (0.37) was determined between the ecotypes Gürpınar and Muradiye. From the ecotypes, the genotypes closest to each other (0.88) were found to be in the population of Gurpinar, but the genotypes farthest to each other (0.41) were found to be in the population of Ercis. Based on Nei genetic diversity, the highest genetic diversity was found in the population of Ercis, while the lowest one was obtained in the population of Gurpinar. Moreover, no very closely related genotypes were detected in the studied ecotypes having high genetic diversity.
Keywords: Alfalfa; Medicago sativa; SSR; genetic variation.
https://doi.org/10.36899/JAPS.2021.2.0241
Published online October 03,2020
INTRODUCTION
Alfalfa (Medicago sativa L.) is a perennial legume providing high quality and high quantity forage used for grazing, hay and silage, as well as green manure and cover crop. Due to these characteristics, it can be found in large plantation areas in the world (Liatukienė and Liatukas, 2014). Therefore, improving alfalfa varieties adapted to different farming systems and growing environments has a lot of importance in applied pasture and agricultural researches (Wang et al., 2011).
Generally, alfalfa breeding studies focus on the development of tolerance to biotic and abiotic stress, increasing the feed value, and increasing the yield. Alfalfa is a species with high genetic complexity at individual and population levels due to its high autotetraploidy and allogamy structure (Labombarda et al., 2000; Tucak et al., 2010).
The study of population genetics in alfalfa is also complicated due to tetraploid structure and severe selfing depression (Falahati-Anbaran et al., 2007). Breeders need to estimate the degree of relationship between both parents and individuals because of the effects of self-depression in outcrossing plants such as alfalfa in order to achieve a high rate of heterosis in parent selection in breeding studies (Dehghan-Shoar et al. 1997). For selecting parents and speeding up the breeding programs, the population structure and genetic differences are required to be known (Qingyuan et al., 2019).
The use of co-dominant marker systems in molecular methods yields effective results in the plant species such as alfalfa having tetraploid structure (Barnes et al., 1988) and in calculating genetic distance of cross-pollinated species (Diwan et al., 1997; Flajoulot et al., 2005; Falahati-Anbaran et al., 2007, Touil et al., 2008). The number of samples in determining genetic differences in tetraploid species has ranged from 10 to 40 (Jenczewski et al. 1999; Kolliker et al., 1999; Flajoulot et al., 2005; Sardaro et al., 2008). It has been reported that the use of SSR markers might be appropriate in differentiating populations (Sabokbari et al., 2013). Qingyuan et al., (2019) examined comprehensively a worldwide collection of alfalfa germplasm by molecular SSR markers to analyze the population structure and genetic diversity, as well as the relationship between genetic variation and geographical regions in worldwide alfalfa, for its effective selection of parents for breeding and to accelerate the cultivar improvement process.
Erosion of genetic diversity in most of the cultivated species emphasizes the need to collect and investigate new germplasm as genetic resources for future breeding programs. Alfalfa is distributed worldwide and grown in highly different climates. This extensive geographical adaptation promotes genetic variation and gives us the opportunity to use diverse gene pools (Tucak et al., 2008).
Turkmenistan, northwest of Iran, northeast of Turkey and Trans-Caucasus are considered to be germplasm center for alfalfa (Michaud et al., 1988). The Eastern Anatolian Region of Turkey, which is located in the gene center, is important in terms of genetic sources. In this region, local varieties of alfalfa are still cultivated (Sabancı et al., 2013). For this reason, local varieties, which have been in the hands of regional farmers for many years and adapted to the region, appear to be a suitable source for breeding activities. In order to make sufficient use of these landraces, it is necessary to know their genetic properties.
In the present study, SSR markers were employed to determine the genetic diversity and degree of relationship of the local ecotypes which are neglected due to the intensive use of highly efficient registered alfalfa cultivars. The degree of genetic relationship and diversity within and among six local alfalfa ecotypes obtained from Van province located at Eastern Anatolian Region of Turkey were examined.
MATERIALS AND METHODS
Materials: Six local alfalfa (Medicago sativa L.) ecotypes obtained from Van province located at Eastern Anatolian Region of Turkey were used as the material (Table 1).
Table 1. The location of the sample alfalfa (Medicago sativa L.) ecotypes.
|
No
|
Province
|
Town
|
Village
|
Latitude
|
Longitude
|
Altitude (m)
|
|
1
|
Van
|
Muradiye
|
Yumaklı
|
38°55’58’’N
|
43°46’07’’E
|
1724
|
|
2
|
Van
|
Ercis
|
Merkez
|
39°01’41’’N
|
43°21’32’’E
|
1693
|
|
3
|
Van
|
Çatak
|
Alacayar
|
38°01’33’’N
|
43°09’33’’E
|
1813
|
|
4
|
Van
|
Gevas
|
Merkez
|
38°17’45’’N
|
43°06’27’’E
|
1689
|
|
5
|
Van
|
Gevas
|
Yemislik
|
38°17’ 48’’N
|
42°55’42’’E
|
1789
|
|
6
|
Van
|
Gurpınar
|
Bozyigit
|
38°23’ 14’’N
|
43°34’19’’E
|
1919
|
Method: DNA isolation of 15 plants, 90 from each ecotype were done according to the modified CTAB method (Doyle and Doyle, 1987). DNA samples were diluted 100 times and their absorbance values were measured spectrophotometrically at 260 nm and 280 nm. DNA samples were diluted to 30 ng by adding ddH2O on the measurement results of the concentrations (Anonymous, 2010). Also, 18 primers having high reported polymorphism (Diwan et al., 2000; Falahati-Anbaran et al., 2007) were employed (Table 2).
PCR amplification was done in 20 µl reaction system containing 30 ng genomic DNA, 50 mM MgCl2, 5.0 µM primer, 0.2 mM each dNTPs, 10x PCR buffer and 1 unit Taq DNA polymerase (Yildiz et al., 2011). The SSR PCR reactions were carried out as follow: denatured (4 min at 94 °C), then (35 cycles of 60 sec at 94 °C, 60 sec at 50-55 °C, and 2 min at 72 °C) and a final extension (at 72 °C for 6 min) (Diwan et al., 2000; Mengoni et al., 2000; Falahati-Anbaran et al., 2007, Herrmann et al., 2018). Amplification products were fractionated on 3 % agarose gel in 1X TAE buffer at 60 V for 4 h. After staining with ethidium bromide, the bands were made visible under UV and different bands of genotypes were defined according to their base weight, then each allele was scored as the presence (1) or absence (0) of the band was determined (Falahati-Anbaran et al., 2007).
Statistical analysis: The genetic distance between genotypes was determined using SIMQUAL program according to Jaccard similarity coefficients and a dendrogram was formed based on UPGMA by NTSYSpc-2.02 (Rohlf, 1997). Nei genetic diversity index and polymorphism rates were determined by POPGENE program (Nei, 1973; Yeh et al., 1997; Labate, 2000).
Table 2. List of primers used in the study.
|
#
|
Primers
|
Interior motif
|
5’ end sense
|
3’ end anti-sense
|
|
1
|
AFat15
|
(AT)23
|
TTACGGGTCTAGATTAGAGAGTATAG
|
CAAAATGAGTATAGGGAGTGG
|
|
2
|
AFca1
|
(CT)4(CA)10
|
CGTATCAATATCGGGCAG
|
TGTTATCAGAGAGAGAAAGCG
|
|
3
|
AFca11
|
(CA)11
|
CTTGAGGGAACTATTGTTGAGT
|
AACGTTTCCCAAAACATACTT
|
|
4
|
AFca16
|
(CA)12
|
GGTCGAACCAAGCATGT
|
TAAAAAACATTACATGACCTCAAA
|
|
5
|
AFct11
|
(CT)12
|
GGACAGAGCAAAAGAACAAT
|
TTGTGTGGAAAGAATAGGAA
|
|
6
|
AFct32
|
(CT)14
|
TTTTTGTCCCACCTCATTAG
|
TTGGTTAGATTCAAAGGGTTAC
|
|
7
|
AFct45
|
(CT)8AT(CT)3
|
TAAAAAACGGAAAGAGTTGGTTAG
|
GCCATCTTTTCTTTTGCTTC
|
|
8
|
AFct60
|
(CT)21
|
CCTCCCTAACTTTCCAACA
|
TGGATCAACGTGTCTTTCA
|
|
9
|
AFctt1
|
(CTT)9(CAA)3
|
CCCATCATCAACATTTTCA
|
TTGTGGATTGGAACGAGT
|
|
10
|
MTLEC2A
|
(AT)19
|
CGGAAAGATTCTTGAATAGAGT
|
TGGTTCGCTGTTCTCATG
|
|
11
|
FMT13
|
(GA)2GG(GA)9
|
GATGAGAAAATGAAAAGAAC
|
CAAAAACTCACTCTAACACAC
|
|
12
|
MTIC451
|
(TC)11
|
GGACAAAATTGGAAGAAAAA
|
AATTACGTTTGTTTGGATGC
|
|
13
|
MTIC189
|
(TC)9
|
CAAACCCTTTTCAATTTCAACC
|
ATGTTGGTGGATCCTTCTGC
|
|
14
|
MAA660456
|
(TTC)8
|
GGGTTTTTGATCCAGATCTTAA
|
GGTGGTCATACGAGCTCC
|
|
15
|
B14B03
|
(CA)9
|
GCTTGTTCTTCTTCAAGCTCAC
|
CTGACTTGTGTTTTATGC
|
|
16
|
MTIC93
|
(TTC)6
|
AGCAGGATTTGGGACAGTTGT
|
ACCGTAGCTCCCTTTTCCA
|
|
17
|
MTIC432
|
(AG)6
|
TGGAATTTGGGATATAGGAAG
|
GCCATAAGAACTTCCACTT
|
|
18
|
MTIC299
|
(ATG)7
|
AGGCTGTTGTTACACCTTTGTC
|
AAATGCTTAAATGACAAAT
|
RESULTS
SSR Amplification: The data about allele band number and base pair weight was obtained by the reading SSR bands profile at 90 alfalfa genotypes from 15 genotypes for each ecotype (Table 3). Total 111 allele bands were determined at 90 genotypes. The studied primers produced 5 to 15 bands. The maximum number of allele bands was obtained from the AFcat32 primer and the least bands were obtained from the AFct11 primer. The lowest and highest base pair weight ranged from 80bp to 550 bp for AFca16 primer.
Genetic Diversity and Relationship Degree: The matrix values based on Jaccard similarity coefficients are presented in Table 4 and the genetic diversity and polymorphisms rates for the studied alfalfa ecotypes are presented in Table 5.
Table 3. Data obtained from SSR primers for the studied alfalfa ecotypes and comparisons with previous studies.
|
Primer
|
Number of alleles
|
Band size range (bp)
|
| |
Previous studies
|
Present study
|
Previous studies
|
Present study
|
|
FMIT13
|
12 (FL)
|
9
|
162-204 (FL)
|
150-215
|
|
MTIC451
|
13 (FL)
|
12
|
145-181 (FL)
145-181 (B)
|
140-180
|
|
MTIC189
B14BO3
|
15 (FL)
|
14
|
133-173 (FL)
|
120-173
|
|
10 (FL)
8 (S)
9 (L)
|
8
|
163-215 (FL)
152-430 (S)
163-215 (B)
152-180 (L)
|
152-185
|
|
Afca1
|
7 (D)
12 (S)
9(L)
|
8
|
112-131 (D)
133-182 (S)
147-183 (L)
|
150-450
|
|
Afca11
|
12 (F)
9 (M)
6 (D)
14 (L)
|
12
|
139-188 (F)
195-199 (M)
136-160 (D)
147-189 (L)
|
135-180
|
|
Afca16
|
8 (F)
7 (D)
4 (S)
6 (L)
|
10
|
89-103 (F)
87-101 (D)
85-550 (S)
92-120 (L)
|
80-550
|
|
AFct11
|
6 (F)
3 (D)
3 (S)
|
5
|
186-196 (F)
178-194 (D)
180-200 (S)
|
185-210
|
|
AFcat32
|
14 (F;M)
9 (D)
11 (S)
8 (L)
|
15
|
103-166 (F)
132-186 (M)
101-157 (D)
100-193 (S)
152-220 (L)
|
100-193
|
|
AFct45
|
7 (F)
5 (D)
7 (S)
|
7
|
132-144 (F)
123-145 (D)
133-193 (S)
|
132-145
|
|
AFctt1
|
11 (F)
14 (M)
10 (D)
|
11
|
100-130 (F)
100-202 (M)
99-126 (D)
|
104-175
|
M: Mengoni et al., 2000, F: Falahati-Anbaran et al., 2007, D: Diwan et al., 2000, FL: Flajoulot et al., 2005, S: Sabokbari et al., 2013, B: Bagavathiannan et al., 2010, L: Liu et al., 2007.
Table 4. Similarity matrix values based on Jaccard similarity coefficients of the alfalfa ecotypes.
|
Ecotypes
|
Muradiye
|
Ercis
|
Catak
|
Gevas-1
|
Gevas-2
|
Gurpinar
|
|
Muradiye
|
1
|
|
|
|
|
|
|
Ercis
|
0.5660
|
1
|
|
|
|
|
|
Catak
|
0.5094
|
0.6792
|
1
|
|
|
|
|
Gevas-1
|
0.4717
|
0.5283
|
0.5472
|
1
|
|
|
|
Gevas-2
|
0.4151
|
0.5094
|
0.4906
|
0.6038
|
1
|
|
|
Gurpinar
|
0.3774
|
0.4717
|
0.5660
|
0.5660
|
0.5849
|
1
|
Table 5. Genetic diversity and polymorphism rates in alfalfa ecotypes.
|
Ecotypes
|
The number of the genotypes
|
Genetic diversity
(Nei genetic diversity index)
|
Polymorphism (%)
|
|
Muradiye
|
15
|
0.1470
|
59.74
|
|
Ercis
|
15
|
0.1736
|
71.43
|
|
Catak
|
15
|
0.1426
|
59.74
|
|
Gevas-1
|
15
|
0.1628
|
74.03
|
|
Gevas-2
|
15
|
0.1595
|
64.94
|
|
Gurpinar
|
15
|
0.1336
|
54.55
|
|
All ecotypes
|
90
|
0.1682
|
100.00
|
The genetic diversity among the studied alfalfa ecotypes ranged from 0.1336 to 0.1736 based on Nei genetic diversity index. When we examined the dendrogram obtained by UPGMA using SM matrix to determine the degree of relationship among six alfalfa ecotypes with SSR markers, the closest similarity (0.68) was observed between Catak and Ercis ecotypes (Figure 1). However, the least similarity was found to be 0.37 in Gürpınar and Muradiye ecotypes. The similarity between the ecotypes (Gaveas-1 and Gevas-2) collected from the same town was 0.60.
The similarity matrix values within ecotypes also revealed that the closest similarity (0.88) was observed between two genotypes in the Gurpinar ecotype, but the least similarity (0.41) was found between two genotypes in Ercis ecotype. Among the studied all 90 genotypes, the closest similarity (0.94) was observed between one genotype in the Muradiye ecotype and one genotype in Catak ecotype, but the least similarity (0.58) was found between two genotypes in Ercis.
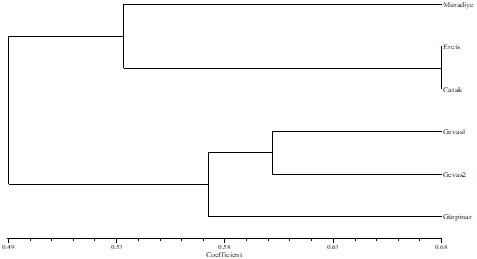
Figure 1. Dendrogram obtained by UPGMA using SM matrix to determine the degree of relationship among six alfalfa ecotypes with SSR markers.
DISCUSSION
SSR Amplification: The data in terms of the number and size of alleles obtained from the present study were similar to those from the previous studies (Diwan et al., 2000; Mengoni et al., 2000; Flajoulot et al., 2005; Falahati-Anbaran et al., 2007; Sabokbari et al., 2013). Falahati-Anbaran et al., (2007) studied the alfalfa populations in Iran and obtained the same band numbers for the primers AFct45, AFctt1, and Afca11 and allele size of the mentioned primers were similar. Similarly, Sabokbari et al., (2013) studied ten alfalfa populations in Azerbaijan and obtained the same band numbers for the primers Afct45 and B14B03 and allele size of the mentioned primers were similar. There was also a close similarity with the number of bands for the primers FMIT13, MTIC451 and MTIC189 as in the study of Flajoulot et al., (2005). However, more bands were obtained for the primers Afca16 and AFcat32 in the present study (Table 3). Mengoni et al., (2000) reported that the number of samples in the population being more than 20 did not significantly change the polymorphism rate and structure. The observed differences among the literature might be arisen from different origin of the populations. As a matter of fact, there are different findings in the results of other researchers (Table 3).
Genetic Diversity and Relationship Degree: According to Nei genetic diversity index, the genetic diversity among the studied 6 alfalfa ecotypes ranged from 0.1336 to 0.1628 (Table 5). Ertus (2011) reported that the by Nei genetic diversity index among 76 alfalfa populations collected from Lake Van Basin of Turkey was 0.217 for RAPD and 0.274 for ISSR primers. Mengoni et al. (2000) reported that Nei genetic diversity index values among their studied alfalfa cultivars and ecotypes ranged from 0.173 to 0.306, and reasoned this high genetic diversity to outcrossing and tetraploid feature of alfalfa. Sabokbari et al., (2013) found Nei genetic diversity values in their studied natural alfalfa populations ranged from 0.0478 to 0.1667.
Conclusion: In current study, the collected alfalfa samples from Van province of Turkey which has been located in the center of origin for alfalfa were molecularly studied. The genetic diversity of 90 alfalfa genotypes (15 from 6 ecotypes) was determined with molecular SSR marker system. It was reassured for providing evidence that SSR markers were informative and suitable to study molecular polymorphism and phylogenetic relationships in the studied alfalfa ecotypes.
Due to outcrossing and tetraploid characteristics of alfalfa, the similarity among the ecotypes ranged from 0.37 to 0.68, but the similarity between two individual genotypes reached to 0.97. The close similarity was not detected among the ecotypes geographically close to each other. However, two genotypes that were close to each other were obtained from different ecotypes. Again, the two furthest genotypes were found in one of ecotype (Ercis). Considering the degree of diversity, it is said that Gurpinar ecotype is more pure and Ercis ecotype is more diverse. The studied alfalfa ecotypes were found to be genetically diverse to each other. There was also high genetic variation within the studied alfalfa ecotypes.
It is reemphasized in the present study that the SSR markers could be used trustfully in establishing the genomic relationship in the ecotypes of alfalfa which is an important legume crop having complex genetic structure. Overall, the results of this study show that high levels of genetic diversity are maintained within the studied alfalfa ecotypes which may act as sources for novel traits. The studied alfalfa ecotypes may also be regarded as a source of genetic material for plant improvement and attempts should be made to identify and conserve such resources.
Acknowledgement: This study was supported by Van Yuzuncu Yil University Scientific Research Projects Unit (Project No. 2013-ZF-B012).
REFERENCES
- Anonymous, (2010). Species and Molecular Identification by DNA Fingerprinted of Work Packagehttp://www.turkhaygen.gov.tr/doc/egitim_ODTU.pdf. TÜBİTAK TÜRKHAYGEN-1 Project. I. Workshop, 2-3 April 2007, ODTÜ. Date of access: 06.03.2010
- Bagavathiannan, M.V., B. Julier, Barre, R.H. Gulden and R.C. Van Acker (2010). Genetic diversity of feral alfalfa (Medicago sativa L.) populations occurring in Manitoba, Canada and comparison with alfalfa cultivars: an analysis using SSR markers and phenotypic traits. Euphytica. 173:419–432
- Barnes, D.K., B.P. Goplen and J.E. Baylor (1988). Highlights in the USA and Canada. In A. A. Hanson Barnes DK. And Hill RR. (eds). Alfalfa and Alfalfa Improvement. Monogr. 29,1-24 J.Soc. Agron. Madison.
- Carelli M., Gnocchi and C. Scotti (2009). Alfalfa germplasm from a Sahara oasis: characterization by means of bio-agronomic traits and SSR markers. Plant Breeding.128:271—277.
- Dehghan-Shoar M., J.G., Hampton and S.E. Gardiner (1997). Genetic analysis among and within populations forming ecotypes and cultivar of alfalfa, Medicago sativa (Leguminosae), using RAPD fragments. Plant Systematics and Evolution. 208:107-119.
- Diwan N., A.A. Bhagwat, G.B. Bauchan and P.B. Cregan (1997). Simple sequence repeat DNA markers in alfalfa and perennial and annual Medicago Genome. 40: 887–895.
- Diwan N., J.H. Bouton, G. Kochert and P.B. Cregan (2000). Mapping simple sequence repeat(SSR) DNA markers in diploid and tetraploid alfalfa. Theor. Appl. Genet. 101:165–172.
- Doyle J.J. and J.L. Doyle (1987). A rapid DNA isolation procedure from small quantities of fresh leaf tissues. Bull, 19: 11-15.
- Ertus, M.M. (2011). The Determination of Morphological and Molecular Diversity Among Some Lucerne (Medicago sativa) Cultivars. Yuzuncu Yil University; Institue of Science. Ph. Dr. Thesis.
- Falahati-Anbaran M., A.A. Habashi, M. Esfahani, S.A. Mohammadi and B. Gharayazi (2007). Population genetic structure based on SSR markers in alfalfa (Medica gosativa L.) from various regions contiguous to the centers of origin of the species. J. Genet. 1:59– 63.
- Flajoulot, S., J. Baudouin, P. Barre, P. Huguet, T. Huyghe, C. and B. Julier (2005). Genetic Diversity Among Alfalfa (Medicago sativa) Cultivars Coming from a Breeding Program, Using SSR Markers. Theor. Appl. Genet. 111:1420-1429.
- Herrmann, D., S. Flajoulot, P. Barre, C. Huyghe, J. Ronfort and B. Julier (2018). Comparison of morphological traits and molecular markers to analyse diversity and structure of alfalfa (Medicago sativa) cultivars. Genet. Resour. Crop. Evol. 65:527–540
- Jenczewski, E., J.M. Prosperi and J. Ronfort (1999). Differentiation between natural and cultivated populations of Medicago sativa (Leguminosae) from Spain: analysis with random amplified polymorphic DNA (RAPD) markers and comparison to allozymes. Molecular Ecology.8(8): 1317-1330.
- Kolliker R., F.J. Stadelmann, B. Reidy and J. Nosberger (1999). Genetic variability of forage grass cultivars: a comparison of Festuca pratensis, Lolium perenne L., and Dactylis glomerata L. Euphytica. 106: 261–270.
- Labate, J.A. (2000). Software for population genetic analyses of molecular marker data. Sci. 40:1521-1528.
- Labombarda, P., F. Pupilli and S. Arcioni (2000). Optimal population size for RFLP- assisted cultivar identification in alfalfa (Medicago sativa L.). Agronomie. 20:233-240.
- Liatukienė, A. and Ž. Liatukas (2014). Downy Mildew Reaction of Alfalfa Accessions of Different Geographical Origin under Lithuanian Conditions. Internatıonal Journal of Agriculture & Biology. 16(5):905–910.
- Liu Z.P., G.S. Liu and O.C. Yang (2007). A novel statistical method for assessing SSR variation in autotetraploid alfalfa (Medicago sativa). Genetics and Molecular Biology. 30(2):385-391.
- Mengoni A., A. Gori and M. Bazzicalupo (2000). Use of RAPD and microsatellite (SSR) variation to assess genetic relationships among populations of tetraploid alfalfa, Medicago sativa. Plant Breeding. 119: 311-317.
- Michaud, R., W.F. Lehman and M.D. Runbaugh (1988). World distribution and historical development. In: Hanson AA, Barnes DK, Hill RR (eds) Alfalfa and alfalfa improvement. Agronomy Monograph. 29, Madison, pp 25–92.
- Nei, M. (1973). Analysis of gene diversity in subdivided populations. Proc. Natl. Acad. Sci. USA. 70: 3321-3323.
- Rohlf, F.J., 1997. NTSYS-Pc: Numerical Taxonomy and Multivariate Analysis System. Exeter Software, New York.
- Qingyuan, H., L. Yanyang, L. Yanlong, L. Zhengpeng, S. Saisai and Z. Qiuwen (2019). Genetic diversity in the worldwide alfalfa germplasm assessed through SSR markers. International Journal of Agriculture & Biology. 22(5): 1205-1210.
- Sabancı, C.O., M.M. Ertuş, Ş. Zorer Çelebi (2013). Collection, conservation and evaluation for forage yield of alfalfa landraces grown in East Anatolia. Turkish Journal of Field Crops. 18(1): 46-51.
- Sabokbari, M., H. Monirifar, Y. Rameshknia, M. Barghi, A.H. Babaiy, S. Amiri and S.A. Nazari (2013). Comparison of RAPD and SSR Marker Efficacy for Genetic Analysis of Native Alfalfa (Medicago sativa) from Various Regions of Azerbaijan. Tekstil Journal. 62(4): 386-395.
- Sardaro, M.L.S., M. Atallah, E. Tavakol, L. Russi and E. Porceddu (2008). Diversity for AFLP and SSR in natural populations of Lotuscorniculatus from Italy. Crop Sci. 48:1080–1089.
- Touil, L., Guesmi, K. Fares, C. Zagrouba and A. Ferchichi (2008). Genetic diversity of some Mediterranean populations of the cultivated alfalfa (Medicago sativa L.) using SSR markers. Pakistan Journal of Biological Science. 11(15): 1923-1928.
- Tucak, M., S. Popovic, T. Cupic, S. Grljusic, S. Bolaric and V. Kozumplik (2008). Genetic diversity of alfalfa (Medicago) estimated by molecular markers and morphological characters. Periodicum Biologorum. 110 (3): 243-249.
- Tucak, M., S. Popović, T. Čupić, S. Grljušić, V. Meglič and Z. Jurković (2010). Efficiency of phenotypic and DNA markers for a genetic diversity study of alfalfa. Russian Journal of Genetics. 46(11):1314-1319.
- Wang, X., Yang, L. Chen, G. Feng, J. Zhang and L. Jın (2011). Genetic diversity among alfalfa (Medicago sativa L.) cultivars in Northwest China. Acta Agriculturae Scandinavica Section B Soil and Plant Science, 61: 60-66.
- Yeh, F.C., R.C. Yang, T.B.J. Boyle, Z.H. Ye, and J.K. Mao (1997). POPGENE, the User Friendly Shareware for Population Genetic Analysis. University of Alberta, Canada. Molecular Biology and Biotechnology Centre.
- Yildiz, M., E. Ekbic, D. Keles, S. Sensoy and K. Abak (2011). Use of ISSR, SRAP, and RAPD markers to assess genetic diversity in Turkish melons. Scientia Horticulturae. 130: 349–353.
|


