ASSESSMENT OF BIOECONOMIC AND MANAGEMENT ASPECTS OF TUNA FISHERY RESOURCE
IN PAKISTAN
M. Mohsin1, Y. Hengbin*2, Z. Luyao3, S. B.
H. Shah4
1College of International Finance and Trade, Zhejiang Yuexiu
University of Foreign Languages, Shaoxing, 312000, China, 2Marine
Resource Management, Wenzhou Business College, Wenzhou, 325000, China, 3Strategic
Management, School of Business, Hanyang University, Seoul, 04763, Korea and 4College
of Fisheries, Ocean University of China, Qingdao, 266003, China
*Corresponding author’s email: 20190251@wzbc.edu.cn
ABSTRACT
The ongoing open-access regime in Pakistan
raises a big question regarding the management and economic performance of
commercially important fishery resources in Pakistan, such as tuna nei. This
study appraises the management and economic aspects of tuna nei fishery through catch statistics (1995-2009) and survey data. The Gordon-Schaefer
model was used to estimate levels of harvests and their corresponding efforts
for three exploitation levels: maximum economic yield (MEY), maximum
sustainable yield (MSY), and open-access yield (OAE). At MSY, the harvest,
effort, and revenue were HMSY = 10,299 MT, EMSY = 1,382,
and ∏MSY = 40.325 billion PKR; at MEY, they were HMEY
= 10,267 MT, EMEY = 1,305, and ∏MEY = 40.468 billion
PKR; and at OAE, harvest and effort were HOAY = 2,181 MT and EOAY
= 2,610, respectively. Results find that effort is high for all
exploitation levels and needs to reduce. Since tuna nei is biologically
overfished, decrease in effort will result in not only larger catches but also
more revenue. Revenue generated at MEY compared with MSY is significantly
higher, which can be achieved by lowering effort. Thus, it is prerequisite to
formulate and enforce fishery policies that simultaneously control effort,
conserve tuna nei fishery, and increase revenue.
Keywords: maximum economic
yield, bioeconomics, revenue, GS model, tuna, management, Pakistan
https://doi.org/10.36899/JAPS.2020.6.0172
Published online August 03,2020
INTRODUCTION
Fisheries
management is a complex process performed to achieve ecological, biological,
economic, and social goals (Cochrane, 2002). In this process, data related to
catch statistics, i.e., catch and effort are usually used to conserve fishery
stock (Kar and Chakraborty, 2011). Several recent scientific studies employ
catch statistics to develop management strategies for sustainably utilizing
fishery resources and increasing the economic efficiency of marine commercial
fishery (Hinton and Nakano, 1996; Maunder and Punt, 2004; Maunder et al.,
2006). To analyze catch statistics and other fisheries-related data
scientifically, several statistical models are used in the field of fisheries
economics (Seung and Waters, 2006). Among these models, the Gordon-Schaefer (GS)
model is very popular in fisheries economics and management (Udumyan et al.,
2010) and has a long synthesis history. In 1954, a Canadian scientist named
Scott Gordon laid the foundation of fisheries economics by presenting his
theory. Afterwards, another scientist called Schaefer borrowed Gordon’s ideas
and merged them with his own thoughts to create a mathematical model—the GS
model (Habib et al., 2014).
The GS model explains the
relationship between fishing activities and the fishery stock’s biological
growth. It is based on two assumptions. First, per capita growth rate (r)
is highest when the fishery population is small. Second, fish price and
cost remain stable over time (Mohsin,
2017). Using this model and considering three reference points—maximum economic
yield (MEY), maximum sustainable yield (MSY), and open-access equilibrium (OAE)—the
fishery’s revenue can be explained. At MEY, the maximum profit is made through
fishing. On the other hand, the profit margin decreases at MSY. In contrast with
MEY and MSY, normal profit is obtained at OAE, which is necessary to keep fishers
in the fishery business (Fig. 1).
In the field of
fisheries management, two reference points, MEY and MSY, are used depending on
the aim of management. MEY is used to increase profit margins (Christensen, 2010), whereas MSY is generally
used to biologically conserve fishery stock (Kumar et al., 2017). In
this regard, economists strongly prefer MEY to MSY, because operating fishery
at MEY not only increases profit but also biologically conserves fishery stock (Gordon, 1954;
Grafton et al., 2007). Due to these benefits of operating fishery at MEY,
several countries have implemented MEY to manage their fishery resources (Black, 2007; Tabureguci, 2007).
Despite these claims, MEY’s benefits over MSY are not obvious (Tabureguci, 2007).
In fact, MEY is estimated by considering the economics of individual fishing
boats, and other aspects of the fishery industry, such as marketing,
distribution, and processing are ignored (Christensen, 2010). Therefore, MSY has
an advantage over MEY. However, employing MSY for fishery management is also
risky, as the catch can unintentionally go beyond the MSY due to the open-access
conditions (Hardin,
1968).
Tuna is a large pelagic
fishery resource of Pakistan. The contribution of large pelagic fishery to the
total marine catch is over 20%. Most of this catch is sent to Iran either by
boats located in Gwadar or land vehicles. Small-sized, dried, and salted tuna,
viz., frigate, kawakawa, and bullet tuna, are exported to Sri Lanka. Tuna
fishing season peaks in March and spans over six months, that is, November to
April. This resource is commercially hunted through gillnetters located in four
cities, viz., Gwadar, Jiwani, Karachi, and Pasni. This fishery is known as
inshore tuna fishery. Wooden boats, 7–11 m long, fitted with 33–200 hp inboard
or 7–33 hp outboard engines locally known as hora (Sindhi language) and rachin
(Balochi language) are used for inshore tuna fishery. Gillnets usually range
from 3–5 km with mesh size from 5–14 cm. On the other hand, offshore tuna
fishery is conducted by wooden boats of sizes ranging from 12–15 m and
inboard fitted engines of 50–500 hp. Most offshore tuna fishing fleets are
concentrated in Karachi, Gwadar, and Jiwani. Gillnets used by these boats are
made of polyamide or nylon material with mesh size of 15 cm (Khan, 2017; FAO,
2009).
Tuna export from Pakistan
has an enormous potential to increase (Customstoday, 2017). However, this
opportunity has some associated disadvantages such as overexploitation, because
it encourages fishers to catch more fish stock. Reported statistics indicate that
the declining capture production of this fishery resource (MFD, 2012) is an
alarming situation. In addition, higher tuna prices offered by Iran compel fishers
to illegally trade tuna for money (Undercurrent News, 2014). Both these
situations act as catalysts to increase tuna catches. It is reported that tuna
fishery is likely affected negatively by overexploitation (FAO, 2009). Such overexploitation,
if not controlled, will not only result in the decline of tuna capture
fisheries but also overcapitalization of fishing fleets due to the fishery
economic phenomenon because of decline in revenue. Despite it being very
important fishery resource, prior literature highlights other aspects of tuna
fishery in Pakistan (FAO, 2009; Moazzam and Nawaz, 2014). Thus, it is necessary
to evaluate the fishery status of this resource and describe its bioeconomics
comprehensively. For this purpose, this study employs a famous fishery model, the
GS model, as the first attempt in this regard.
MATERIALS AND METHODS
Data procurement: For this study,
data were obtained from multiple sources such as research papers, research
reports, official surveys, and online websites. Both desk and field studies were
conducted to collect data. Moreover, an extensive review of literature was done
to understand the principles of fisheries economics. These concepts were used later
for elaborating the obtained results and perceiving the ongoing bioeconomic and
management implications of commercial tuna fishery in Pakistan. In this study,
two types of data were used. First, commercial catch and effort data for 1995–2009
on tuna nei fishery in Pakistan were obtained from an officially published book
by Marine Fisheries Department of Pakistan (MFD), viz., Handbook of Fisheries
Statistics of Pakistan (MFD, 2012). It is necessary to mention that MFD is the
sole official department which published statistics related to marine catch in
Pakistan. The latest published statistics by MFD are up to 2009. Thus, we have
used the latest available catch statistics of tuna nei fishery in this study.
Second, data on unit price of the harvest and
unit cost of fishing effort were estimated through survey data gathered from the
Boat Builder Association, Karachi, and the Karachi Fisheries Harbor Authority. This
data was collected through questionnaire survey designed specifically for this
study. This survey was conducted at Karachi during January and February 2019. Face
to face interviews were done to ensure reliability of the data obtained. In
total, 10 participants took part in this survey among which 5 were from the
Boat Builder Association, Karachi, whereas, 5 were from the Karachi Fisheries
Harbor Authority. Details of the survey participants are given in Table 1.
Data analysis: The GS model
was selected for the current study to analyze the commercial marine tuna
fishery in Pakistan, which is generally considered to be under an open-access
regime. The GS model uses a logistic growth equation represented as follows:
 (1) (1)
Where,
F(X) represents surplus biomass growth per unit of time, X stands
for stock biomass, K is carrying capacity, and r denotes
intrinsic growth rate. This equation refers to the parabolic curve as a
function of X, graphically represented in equation 1.
The
harvest rate (H) was estimated by using the simple relation of the Schaefer
catch function given as follows:
 (2) (2)
Where, H (E,
X) is the catch per unit of time measured in terms of harvest rate or
biomass, q is the constant catchability coefficient, and E is
fishing effort.
When population at
equilibrium and harvest equals the sustainable yield conditions, the surplus
growth is [H (E, X) = F (X)] or when rate of
change of biomass is equal to . Based on
equations (1) and (2), qEX = rX(1 - X/K). Thus,
biomass at equilibrium (X) is obtained as follows: . Based on
equations (1) and (2), qEX = rX(1 - X/K). Thus,
biomass at equilibrium (X) is obtained as follows:
 (3) (3)
The long-term
catch equation can be derived by inserting (4) into (2) as follows:
 (4) (4)
The linear
relationship between the catch per unit effort (CPUE) and fishing effort can be
derived by dividing both sides of (5) with effort (E) as follows:
 (5) (5)
Total revenue (TR)
in equilibrium as a function of standardized effort can also be defined from
equation (5) by considering constant price as follows:
 (6) (6)
In this
mathematical equation, p denotes the constant price per unit of the
harvest. Similarly, total cost (TC) of fishing effort is given as follows:
 (7) (7)
Where, c is
the unit cost of effort. This cost comprises fixed, variable, and opportunity costs of
capital and labor. Fixed costs do not depend on fishing operations (insurance,
depreciation, and administration). Variable costs (e.g., for bait, fuel, and
food) emerge when fishers go fishing. Opportunity costs refer to benefits that
could have been achieved in the next best economic activity such as alternative
employment, other regional fisheries, or capital investment. Hence, these costs
should also be considered when estimating the total cost of fishing (Cochrane, 2002).
At equilibrium,
resource rent as a function of fishing effort can be derived from equations (7)
and (8) as follows:
 (8) (8)
Different
parameters are estimated through regression of the CPUE statistics on the
corresponding fishing effort. The results are presented in Table 2. It is
necessary to mention that, for this study, it is assumed that average revenue (AR
= TR/E) is equal to marginal cost [(MC = TC (E)].
Hence, from (7) and (8), we get
 (9) (9)
The stock biomass
under the open-access regime is  .
(10) .
(10)
The long-term
harvest function from equation (4) can be expressed as follows:
 (11) (11)
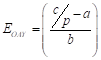
Where,
 and and  .
Since, the time-series catch and effort statistics of commercial tuna fishery
in Pakistan are available, the “a” and “b” values can be computed
by the linear regression of the CPUE on the relative fishing effort data. The
results are presented in Table 2. From the above estimated “a” and “b”
values, K and r can also be calculated as follows: .
Since, the time-series catch and effort statistics of commercial tuna fishery
in Pakistan are available, the “a” and “b” values can be computed
by the linear regression of the CPUE on the relative fishing effort data. The
results are presented in Table 2. From the above estimated “a” and “b”
values, K and r can also be calculated as follows:
 (12) (12)
 (13) (13)
So,  can be expressed as follows: can be expressed as follows:
 (14) (14)
EMSY
can be estimated by using equation (11) as follows:
 (15) (15)
Thus, . (16) . (16)
At the open-access
equilibrium, TR (E) = TC (E). Using equations (6)
and (7)  = = ,
Hence, EOAY can be estimated by using the GS model and the following
equation: ,
Hence, EOAY can be estimated by using the GS model and the following
equation:
 (17) (17)
The maximum
economic yield (∏MEY) can only be obtained by employing less
total fishing effort. Moreover, economic rent (positive) can only be obtained
at effort levels that are than EOAY. Thus, MEY is obtained at the
profit maximizing level by using equation (8) as follows:
 or or 
Hence, EMEY
is obtained as follows:
 (18) (18)
RESULTS
This study uses catch statistics (1995-2009), harvest price, and
fishing cost of tuna nei fishery in Pakistan. During the study period, the maximum,
minimum, and average catch of tuna nei fishery were observed for 2004 (12,862
MT), 2000 (5,773 MT), and 9,881 MT per year. On the contrary, maximum and
minimum effort was observed in 2009 (1,866) and 1995 (932), respectively (Fig.
2). Furthermore, the computed results indicate that the estimated CPUE varied
between 4.377 and 10.620. Results also showed that during the last five years
of this study, CPUE decreased from 6.966 (2005) to 5.130 (2009) (Fig. 3). The respective
values of a and b were calculated as 14.901 and -0.00538.
Regression analysis of CPUE was conducted on the corresponding effort level to obtain
these values. The standard error estimates of a and b remained at
1.733 and 0.001, correspondingly. The R2 value obtained after
regression analysis was 0.558. This value shows that the variation in CPUE data
is 55.8% (Table 2). The values of K (458,976 MT) and r (0.089)
were computed by inserting the estimates of a (14.901), b (-0.00538),
and q (3.25E-05) in equations (12) and (13).
In
this study, the GS model was employed to compute three types of very important
fishery parameters: harvest levels (HMSY, HMEY, and HOAY),
effort levels corresponding to the harvest levels (EMSY, EMEY,
and EOAY), and economic rent (∏MSY and ∏MEY).
To estimate the harvest level values, a and b were solved in
equation (11), while, the respective effort levels were computed by using
equations (15), (17), and (18). On the other hand, equation (8) was used to
estimate economic rent. Computed values of the harvest, effort, and economic
rent levels are given in Table 3. The calculated values of HMSY, HMEY,
and HOAY remained at 10,299 t, 10,267 t, and 2,181 t, respectively. Here,
a 95% confidence interval was used to estimate the lowest and highest bounds of
these harvest levels. The estimated values of these bounds remained at 3,790–32,546
t, 3,768–32,481 t, and 1,058–5,548 t, in that order. In addition, the estimated
values of EMSY, EMEY, and EOAY were computed as
1,382, 1,305, and 2,610, correspondingly. Similar to harvest, a 95% confidence
interval was used for the effort level to compute the lowest and highest
bounds. The estimated bounds for these levels were 685–3,475, 633–3,320, and 1,266–6,639,
respectively. The estimated values of TR and TC at EMSY were
computed as 45,419,562,999 PKR and 5,094,312,488 PKR, respectively. Subtracting
TC from TR, the economic rent at MSY (∏MSY) was obtained as 40,325,250,510
PKR. On the other hand, at EMEY, computed values of TR and TC
remained at 45,276,716,954 PKR and 4,808,620,399 PKR, respectively. Hence, the
calculated value of the economic rent at MEY (∏MEY),
subtracting TC from TR, is 40,468,096,555 PKR.
Table 4 presents
estimates of two types, that is, cost per unit effort (c) and price per
unit harvest. These estimates were made using survey data specifically gathered
for this study. Three types of costs were considered for estimating c:
fixed costs, variable costs, and opportunity costs. Aggregate c was
calculated as 3,685,000 PKR per gillnetter per year. Total fixed cost (1,405,000 PKR) was calculated
by adding the depreciation (25% on the average price of gillnetter; 1,375,000 PKR),
registration fee (10,000 PKR), and license fee (20,000 PKR). Total variable
cost per annum (2,160,000 PKR) was computed by considering fuel expenses (600,000
PKR) and labor
expenses (10,000 PKR per person per month). It is essential to mention that
estimates for variable costs were made for nine months in a year, because tuna
fishing is done about nine months in a year. During the remaining three months,
fishers take rest, repair boats, or engage in other business. Opportunity cost
(120,000 PKR) was calculated by
considering the estimated minimum labor wages of labor, i.e. at 10,000 PKR per
month. On
the other hand, price per unit harvest (4,410,000 PKR per year) and average per kilogram
wholesale price of tuna nei (300 PKR) was used.
Average per annum catch of tuna nei fishery was computed as 14,700
kg/gillnetter.
DISCUSSION
This study obtains
several results about the ongoing tuna nei fishery regime in Pakistan. The
results show that capture production is decreasing due to the increasing
fishing effort. It clearly indicates that tuna nei fishery is experiencing
overexploitation in Pakistan, similar to many other fishery resources that are
also being overexploited, as reported by several researchers (Memon et al.,
2015; Mohsin et al., 2017). This condition represents poor fishery
management in Pakistan. Unfortunately, in the past, fishery-related issues did
not receive proper attention from the government. The first comprehensive effort
toward creating a concrete fishery legislation was made in 2004. For this purpose,
the FAO (Food and Agriculture Organization of the United Nations) and Ministry
of Food, Agriculture, and Livestock collaborated to devise Pakistan’s first
inclusive fisheries policy in 2007, called the National Policy and Strategy for
Fisheries and Aquaculture Development in Pakistan. According to this policy’s
section 2.A, a majority of the fishery resources are overexploited (GoP, 2007).
This study indicates that tuna nei fishery was overexploited in the past as the
catch for previous several years had been above the harvest level at either MSY
(HMSY = 10,299 MT) or MEY (HMEY = 10,267 MT).
Several prior studies
conclude that overexploitation is a product of increased fishing effort (FAO,
1999), which has increased uncontrolled in Pakistan. A published report
declares that, in Sindh, the number of trawlers is double the number of recommended
ones (Schmidt, 2014). This is the same with gillnetters operating in
Baluchistan, as the effort required at MSY (EMSY = 1,382) and MEY (EMEY
= 1,305) was achieved in 2004. Thus, the number of operating gillnetters,
1,866, is considerably high compared with the number at MSY and MEY. Although,
sections 2A.2 and 2A.3 of the national policy insist on controlling the fishery
catch and fishing effort (GoP, 2007), practical implementation of this policy
seems vague. As Pakistan follows FAO’s Code of Conduct of Responsible
Fisheries, it must control this ongoing situation (FAO, 1995). CPUE trends have
the potential to indicate the state of the fishery. There are three
possibilities with respect to the change in CPUE. First, a stable CPUE
generally indicates that fishery is not affecting the fish stock. Second, an
increasing CPUE signposts that fishery has the possibility to flourish. Third, a
decreasing CPUE usually suggests that fish stock is experiencing
overexploitation (Hoggarth et al., 2006). The CPUE of tuna nei fishery
in Pakistan is declining over time, which also indicates overexploitation.
In addition to the
catch and effort trends and CPUE drifts, some other reference points such as
MSY also indicate the state of the fishery. If the computed values of MSY are
greater than the observed catch values in this condition, more fishing can be done.
On the other hand, if the estimated MSY is lower than the observed catch values,
the situation clearly represents overexploitation of the fishery resource
(Hoggarth et al., 2006). Thus, this study indicates that there is overexploitation
of tuna nei fishery in Pakistan. Overexploitation results in economic losses. Fishers
try to make more and more profit by increasing their catches, which results in larger
fishery catches. The fish stock may encounter extinction if this increase in
fish catches is not stopped (Clark, 1973). However, several studies indicate that
higher economic gain is associated with overexploited fish stock (Grafton et
al., 2007).
By considering the
results, that is, decrease in tuna nei fishery catch, increase in fishing
effort, decrease in CPUE, and the computed MSY levels, it is confirmed that the
tuna nei fishery resource is experiencing overexploitation. However, use of
more recent and comprehensive data is suggested for making decisions in this
regard. The results obtained are exactly according to the description of the GS
model, wherein revenue is maximum at MEY. At MEY, the calculated revenue
(∏MEY = 40.468 billion PKR) is higher than the computed
revenue at MSY (∏MEY = 40.325 billion PKR). To obtain this
revenue, the effort must be reduced to the corresponding effort level at MEY (EMEY
= 1,305). If the fishing effort is not controlled in the future, the cost of
fishing will rise and revenue will decrease due to the economic phenomenon of
the open-access regime mechanism (Hardin, 1968). Thus, to avoid this condition,
the existing fishery policies should be revised, and more attention should be
paid to the increase the total economic revenue and reduce total cost with
proper implementation of these policies to achieve these goals.
As a member of the
Indian Ocean Tuna Commission, Pakistan is responsible for managing tuna fishery
(FAO, 2009). To achieve this, it is suggested that Pakistan reduce the fishing
effort and implement a of quota system. For this purpose, the scope and perspective
of the existing fisheries management policies should be diversified. Rather than
focusing on limited aspects of the fisheries, policies should encompass various
aspects such as fishery resource rent, revenue, and cost. This can be achieved
by involving all the stakeholders.
Finally, it is
necessary to mention that similar to other statistical models, the GS model
used in this study has some limitations due to various non-real assumptions.
For instance, mortality, growth, and recruitment have positive impacts on the catch
and effort relationship. The catchability coefficient remains stable and does
not change with the passage of time. Although CPUE represents the impartial
abundance of index, the biological process and spatial distribution are ignored.
Moreover, technological and ecological considerations of the fishery stock are
not considered by this model. The reasons for fluctuations in the fishery
process due to fishing or natural processes are not clear (Seijo et al.,
1998). Although, these assumptions may not be met practically, however, this is
a comprehensive model that can be used to understand the fate of fishery under the
natural open-access regime and has the potential to describe the economic
efficiency of fisheries (McGoodwin,
1995; Valatin, 2000).
This study indicates that tuna nei fishery may experience overexploitation,
mainly because of increase in corresponding effort, if there is no any
effective management and conservation policy. Since, exploitation levels of
tuna nei fishery has already achieved both MSY and MEY, thus there is a dire
need to observe dynamics of this fishery resource for its sustainable long-term
exploitation. Introduction of new fishing technology can also threaten tuna nei
fishery resource. Thus, not only increase in effort should be controlled but
also performance of current fishing ways should be monitored. However, effort
reduction can result in unemployment which may cause social disorder because in
Pakistan most of the coastal communities mainly rely on fishing for earning
their livelihood. In order to encounter the effects of effort reduction individual
transferable quotas and individual quotas of habitat impact units approaches
may be adopted (Squires et al., 1998; Holland and Schier, 2006). Moreover,
monitoring and implementing fishery policies and regulation will also assist to
improve the situation. Furthermore, in order to strengthen fisheries sector as
a whole, more in depth studies should be conducted related to economic and
management aspects of fishery resources before making any management plan as
this study is just a preliminary study.
Acknowledgments:
The
authors are very grateful to Marine Fisheries Department (MFD) of Pakistan,
Karachi Fisheries Harbor Authority and Boat Builder Association for providing
us the data. We are also thankful to Zhejiang Yuexiu University of Foreign
Languages and the Foundation of Scientific Research for Inviting
Talents Wenzhou Business College (RC201910) for funding this study.
Table
1. Frequency analysis of research participants
|
Categories
|
Frequency
|
Percentage
|
|
Status
|
Senior
Research Fellow/Others
|
6
|
60.0
|
Status(사회적 지위)
Associate Research Fellow/Others |
4
|
40.0
|
|
Education
|
Ph.D.
|
3
|
30.0
|
Education (교육)
Masters/Bachelor/Others |
7
|
70.0
|
|
Working
experience
|
Between 5
to 10 years
|
7
|
70.0
|
Working
experience(근무경험)
More than 10 years |
3
|
30.0
|
|
Region/Department
|
Boat Builder
Association, Karachi
|
5
|
50.0
|
Region (지역)
Karachi Fisheries Harbor Authority |
5
|
50.0
|
|
Total
|
10
|
100.0
|
Table
2. Regression analysis of catch per unit effort on
the corresponding effort level of commercial tuna nei fishery of Pakistan
(1995-2009)
|
Parameters
|
Coefficients
|
Standard Error
|
Lower 95%
|
Upper 95%
|
|
a
|
14.901
|
1.733
|
11.069
|
18.733
|
|
b
|
-0.00538
|
0.001
|
-0.0080
|
-0.0026
|
* Adjusted R2
= 0.558
Table
3. Harvest, effort, and economic rent estimates
of maximum sustainable, economic, and open-access yield of tuna nei fishery in Pakistan
HMSY
(MT)
|
EMSY
|
∏MSY
(Billion PKR)
|
HMEY
(MT)
|
EMEY
|
∏MEY
(Billion PKR)
|
HOAY
(MT)
|
EOAY
|
|
10,299
*(3,790–32,546)
|
1,382
(685–3,475)
|
40.325
|
10,267
*(3,768–32,481)
|
1,305
*(633–3,320)
|
40.468
|
2,181
*(1,058–5,548)
|
2,610
*(1,266–6,639)
|
Table 4. Cost per unit effort (c) and price per unit
harvest for tuna nei fishery in Pakistan
|
COST PER UNIT
EFFORT
|
FIXED COST
|
|
Depreciation
= 25% on avg. price of gillnetter
|
1,375,000
|
|
Registration
fee
|
10,000
|
|
License
fee
|
20,000
|
|
TOTAL
FIXED COST
|
1,405,000
|
|
VARIABLE COST
|
|
TOTAL
VARIABLE COST PER ANNUM
|
2,160,000
|
|
OPPORTUNITY COST
|
|
Minimum
wage of labor/month
|
10,000
|
|
TOTAL
OPPORTUNITY COST PER ANNUM
|
120,000
|
|
COST PER UNIT EFFORT (c)
= PKR 3,685,000
PKR/gillnetter/year
|
|
PRICE PER UNIT
HARVEST
|
Avg.
price/kg
|
300
|
|
Avg.
catch per unit effort
|
14.7
MT/gillnetter/year
|
|
1
MT
|
1,000 Kg
|
|
Per
annum catch in Kg
|
14,700
Kg/gillnetter/year
|
|
PRICE PER UNIT HARVEST (p)
= 4,410,000
|
*Different cost and price values are in PKR (1 USD = 142.38
PKR).

Fig. 1.
Graphical description of Gordon-Schaefer model.
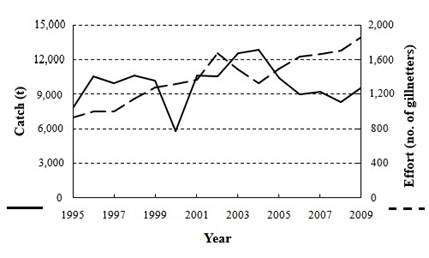
Fig. 2.
Catch (MT) and effort (no. of gillnetters) statistics for tuna nei fishery in
Pakistan.

Fig. 3.
Computed cost per unit effort (CPUE) for tuna nei fishery in Pakistan.
REFERENCES
- Black, R. (2007). Catch cuts ‘bring bigger profits’. BBC News. Retrieved from:http://news.bbc.co.uk/2/hi/science/nature/7127761.stm.
- Christensen, V. (2010). MEY = MSY. Fish Fish. 11: 105-110.
- Clark, C. W. (1973). The economics of overexploitation. Science. 181: 630-634.
- Cochrane, K. L. (2002). A fishery manager's guidebook: management measures and their application (No. 424). FAO, Rome, Italy.
- Customstoday. (2017). Hong Kong to import tuna fish from Pakistan. Retrieved from: http://www.customstoday.com.pk/hong-kong-to-import-tuna-fish-from-pakistan/.
- FAO. (1995). Code of conduct for responsible fisheries. FAO, Rome, Italy.
- FAO. (1999). International plan of action for the management of fishing capacity. FAO, Rome, Italy.
- FAO. (2009). The Islamic Republic of Pakistan. Fishery and aquaculture country profile. Retrieved from: http://www.fao.org/fishery/docs/DOCUMENT/fcp/en/FI_CP_PK.pdf.
- GoP. (2007). National policy and strategy for fisheries and aquaculture development in Pakistan. MINFAL, Govt. Pakistan., Islamabad. 13 p. Retrieved from: http:// faolex.fao.org/docs/pdf/pak150786.pdf.
- Gordon, H. S., (1954). The economic theory of a common-property resource: the fishery. J. Polit. Econ. 62: 124-142.
- Grafton, R. Q., T. Kompas, and R. W. Hilborn (2007). Economics of overexploitation revisited. Science. 318: 1601-1601.
- Habib, A., M. H. Ullah, and N. N. Duy (2014). Bioeconomics of commercial marine fisheries of Bay of Bengal: status and directions. Econ. Res. Int. 1-10.
- Hardin, G. (1968). The tragedy of the commons. Science. 162: 1243-1248.
- Hinton, M. G., and Nakano, H. (1996). Standardizing catch and effort statistics using physiological, ecological, or behavioral constraints, and environmental data, with applications to blue marlin (Makaira nigricans) and swordfish (Xiphias gladius) of the Pacific Ocean. Ph.D. thesis. University of California, San Diego.
- Hoggarth, D. D., S. Abeyasekera, R. I. Arthur, J. R. Beddington, R. W. Burn, A. S. Halls, G. P. Kirkwood, M. McAllister, P. Medley, C. C. Mees, G. B. Parkes, G. M. Pilling, R. C. Wakeford, and R. L. Welcomme (2006). Stock assessment for fishery management - A framework guide to the stock assessment tools of the fisheries management science programme. FAO Fisheries Technical PaperNo. 487. 261 p.
- Holland, D. S., K. E. Schier (2006). Modeling a rights-based approach for managing habitat impacts of fisheries. Nat. Resour. Model. 19: 405-435.
- Kar, T. K., and K. Chakraborty (2011). A bioeconomic assessment of the Bangladesh shrimp fishery. World J. Model. Sim. 7: 58-69.
- Khan, M. W. (2017). Tuna fishery in Pakistan. Pakistan’s national report to the scientific committee of the Indian Ocean Tuna Commission. Marine Fisheries Department. Govt. of Pakistan. 23 p. Retrieved from: https://www.iotc.org/sites/default/files/documents/2017/11/IOTC-2017-SC20-NR20_-_Pakistan_Rev_1.pdf.
- Kumar, R., J. T. Pitcher, and A. D. Varkey (2017). Ecosystem approach to fisheries: exploring environmental and trophic effects on maximum sustainable yield (MSY) reference point estimates. PLOS ONE 12: e185575.
- Maunder, M. N., and A. E. Punt (2004). Standardizing catch and effort data: a review of recent approaches. Fish. Res. 70: 141-159.
- Maunder, M. N., J. R. Sibert, A. Fonteneau, J. Hampton, P. Kleiber, and S. J. Harley (2006). Interpreting catch per unit effort data to assess the status of individual stocks and communities. ICES J. Mar. Sci. 63: 1373-1385.
- McGoodwin, J. (1995). Crisis in the world’s fisheries: people, problems, and policies. Stanford University Press, California. 235 p.
- Memon, A. M., K. H. Memon, W. A. Baloch, A. Memon, and A. Baset (2015). Evaluation of the fishery status for King Soldier Bream Argyrops spinifer in Pakistan using the software CEDA and ASPIC. Chin. J. Oceanol. Limn. 33: 966-973.
- MFD. (2012). Handbook of fisheries statistics of Pakistan. Marine Fisheries Department, Govt. of Pakistan, Fish Harbor, West Wharf, Karachi.
- Moazzam, M., and R. Nawaz (2014). By-catch of tuna gillnet fisheries of Pakistan: a serious threat to non-target, endangered and threatened species. J. Mar. Biol. Ass. India. 56: 85-90.
- Mohsin, M. (2017). A comparison of Molluscan fisheries between China and Pakistan: landings, trade and stock status. Ph.D. thesis. College of Fisheries. Ocean University of China.
- Mohsin, M., Y. T. Mu, A. M. Memon, M. T. Kalhoro, and S. B. H. Shah (2017). Fishery stock assessment of Kiddi shrimp (Parapenaeopsis stylifera) in the Northern Arabian sea coast of Pakistan by using surplus production models. Chin. J. Oceanol. Limn. 35: 936-946.
- Schmidt, U. W. (2014). Fisheries policy report and recommendations for Sindh. USFIRMS Project, USAID. Retrieved from: http://pdf.usaid.gov/pdf_docs/PA00K7T7.pdf.
- Seijo, J.C., O. Defeo, and S. Salas (1998). Fisheries bioeconomics, theory, modelling and management. FAO Fisheries Technical Paper No. 368. 108 p.
- Seung, C. K., and E. C. Waters (2006). A review of regional economic models for fisheries management in the United States. Mar. Resour. Econ. 21(1): 101-124.
- Squires, D., H. Campbell, S. Cunningham, C. Dewees, R. Q. Grafton, S. F. Herrick, J. J. Kirkley, S. Pascoe, K. Salvanes, B. Shallard, B. Turris, and N. Vestergaard (1998). Individual transferable quotas in multispecies fisheries. Mar. Pol. 22: 135-159.
- Tabureguci, D. (2007). Fishing: pacific management model questioned. Retrieved from: http://www.islandsbusiness.com/islands_business/index_dynamic/containerNameToReplace=MiddleMiddle/focusModuleID=18202/overideSkinName=issueArticle-full.tpl.
- Udumyan, N., D. Ami, and C. Pierre (2010). Integrating habitat concerns into Gordon-Schaefer model. Retrieved from: https://halshs.archives-ouvertes.fr/halshs-00520328/document.
- Undercurrent News. (2014). Smuggled tuna costing Iran $50m per year. Retrieved from: https://www.undercurrentnews.com/2014/05/13/smuggled-tuna-costing-iran-50m-per-year/.
- Valatin, G. (2000). Fisheries management in the Netherlands: an overview. Paper presented to XIIth annual conference of the European Association of Fisheries Economists, Denmark.
|


