ACCESSING THE RISKS FACED BY BALUCHISTAN FISHERIES, PAKISTAN BY USING ANALYTIC HIERARCHY PROCESS (AHP) APPROACH
M. Mohsin1, Y. Hengbin*2 and L. Hua3
1College of International Finance and Trade, Zhejiang YueXiu University of Foreign Languages, Shaoxing, 312000, China and 2School of Finance and Trade, Wenzhou Business College, Wenzhou, 325035, China and 3College of Economics and Management, Jiujiang University, Jiangxi 332005, China
*Corresponding author: 20190251@wzbc.edu.cn
ABSTRACT
Several published studies indicate that the fisheries industry in Pakistan is confronted by diverse types of risks. However, none of these studies neither compares different risk types nor gives priority ranks to risk types faced by Baluchistan fisheries, Pakistan for their effective management. Thus, this study is the first attempt in this regard. In order to gather numerical data, a questionnaire survey was done by contacting fishery experts located in the coastal districts of Baluchistan from 1 September, 2019 to 26 December, 2019. 27 completed questionnaires were collected having a consistency ratio (CR) less than 0.1. Analytic Hierarchy Process (AHP) Expert Choice 2000 software was used for data analysis. This work reveals that Baluchistan fisheries is exposed to five different kinds of risks. Relative importance and priority ranking of these risks, from the most to the least important is ‘management risk’ (0.511), ‘natural risk’ (0.256), ‘ecological risk’ (0.124), ‘market risk’ (0.062), and ‘technical risk’ (0.046). Among all the risk sub-factors studied, the most important sub-factor is ‘overfishing’ (0.314), whereas, the least important sub-factor is ‘infectious disease’ (0.003). To cope with these risk types, several strategies can be employed which include avoiding, transferring, diversifying, and controlling risk. However, for more effective and comprehensive management of Baluchistan fisheries, Pakistan further in-depth research on each risk type is strongly recommended.
Keywords: Risk Types, Fisheries, Management, AHP, Baluchistan, Pakistan
https://doi.org/10.36899/JAPS.2021.5.0340
Published online January 24, 2021
INTRODUCTION
Fishery systems are mostly described by words such as scarcity, variability, uncertainty, etc., because of their compound and complex nature (Hanna, 1997; Charles, 1998). Such words denote that these systems are confronted by diverse risk types. Historically speaking, the word “risk” began to appear in fisheries management literature during the 1990s (Francis and Shotton, 1997). This term denotes that state in which the people can estimate the possible losses by using their previous experience, numerical assessment or investigation (Hirshleifer, 1992). Risk is a notion, which relies on variation in the outside world, scanty knowledge about the outside world, and anticipated state of the world. In a nutshell, risk is a perception of feeling about some bad happening (Sethi, 2010). Three factors are usually considered to be responsible for the use of word “risk” in scientific literature (Francis and Shotton, 1997). Collapse of many fisheries around the world in the past is the first factor in this regard. For instance, Punt and Hilborn (1997) and Horwood (1993) reported a severe decline in the fisheries biomass. Such findings triggered global fishery scientists to figure out reasons for this happening. Moreover, growing public awareness regarding industrial activities, environment and human health is the second factor, which further boosted fisheries risk management studies (Francis and Shotton, 1997; Walters and Pearce, 1996). Furthermore, increasing computing capability in the scientific studies is the reported third factor (Efron, 1979; Caddy and Mahon, 1995).
Thus, under the auspicious of these factors, studies related to fisheries risk management started to pop up. Now, there is a plethora of globally published literature which deals with various aspects of fisheries risk management. For example, it is reported that tsunamis, typhoons, floods, earthquakes, and other kinds of irresistible natural disasters repeatedly happened in the past and resulted in heavy losses to the fishery (Wan and Chen, 2011). Holley et al. (2018) studied the recovery of oysters in the Hudson-Raritan Estuary’s enclosed waters. They found pollution as a potential risk for the aquaculture. As a result of pollution, the profitability of the fishery may be very low or even zero. The polluted environment has resulted in a large number of potentially dangerous inorganic fishery products. Such products caused toxicity to the consumers of aquatic products in the United States (Ahmed et al., 1993). Zhang and Zheng (2016) found that there were own price risk and cross-price risks in aquatic products trade, which was due to the sensitivity of fishery products towards price fluctuations. Fishermen face high financial risk, which is determined by their large annual income fluctuation (Kasperski and Holland, 2013). The fishermen must face both the natural risks, such as typhoons, storm surges, and red tide and the social risks including disease and management risks (Tong and Li, 2011; Dong and Xu, 2003). Some studies also highlight that management authorities usually lack legally harvest strategies and operational errors (Gray and Hatchard, 2008).
Published fisheries risk management literature employs various statistical methods to analyze different problems (Sethi, 2010). However, some methods are very popular and dependable to conduct risk management studies such as decision analysis (Mendoza and Martins, 2006). In this type of analysis, qualitative and quantitative data analysis is done by using statistical tools. Results obtained through decision analysis act as a signpost for any proposed fisheries risk management plan (Linkov et al., 2006). Thus, they are very good choices for managing fisheries risk due to multi-nature of the risks and the diverse objectives of the stakeholders (Sethi, 2010). Multi-criteria decision making (MCDM) is a type of decision analysis for risk management and is used specifically for the fisheries sector. This technique is commonly used for doing reliable, dependable and professional analysis (Leung, 2006; Kjaersgaard, 2007). This technique can be employed by policy makers, management body, resource manager, policy analyst and resource analysts. It targets to rank set of policies and regulations. However, MCDM technique has some problems as well. Such as, in this technique, trade-off dominates, focuses only on stakeholder objectives and regulation selection minimizes risks of falure to achieve management goals (Sethi, 2010). This technique suggests various action options against some specific target objectives and it also ranks them quantitatively. Many scientific studies apply this technique through a very famous statistical tool, viz., Analytic Hierarchy Process (AHP). AHP is a sophisticated program, which involves stakeholder’s predilections (Saaty, 1990; Zahedi, 1986). AHP depends on the rational assumptions in accordance with the stakeholder’s focus on priority ranking of risk factors. AHP has an ability to decompose problems into the smaller choices. AHP algorithms give ranks to the options quantitatively against various action choices especially when stakeholders have some option preferences. Because of this feature, AHP is considered trustworthy statistical approach used in fisheries risk management (Sethi, 2010). Considering popularity, relevance, and advantages of AHP, this study employs AHP statistical routine.
According to the published literature, the risk management is done in two phases. First, identification and characterization of the perceived risk is done for its management. Second, risk is treated according to the results and perceived options (Lehar, 2005; Outreville, 1998). Some scientists call these two stages as risk assessment and risk management (Pearse and Walters 1992; Stephenson and Lane, 1995). For this article, the term risk management will represent both of these stages simultaneously. Precautionary approach is suggested to follow during the decision making process (FAO, 1996; Punt, 2006). This approach simply emphasizes on risk avoiding strategy and argues to take action only when that particular action is perceived harmless (Foster et al., 2000) In Pakistan, there is a growing trend of conducting fisheries risk studies particular after 2000. Such as, Mohsin et al. (2019) did stock assessment analysis of carangoides fishery resource of Pakistan. They found that this fishery resource is experiencing the risk of overexploitation. Therefore, they suggested to lower the catch levels to safeguard this resource. Similarly, Kiran et al. (2017) conducted research on mussels and found that this creature is severely affected by growing pollution along the coastal area. The authors recommended to control the risk of pollution for long-term contribution of this fisheries resource. Likewise, some other researchers also found risks faced by various commercially important fisheries resources (Noman et al., 2019; Noman et al., 2018).
Therefore, previously published studies remained confined to a single type of risk faced by the fisheries. Moreover, majority of these studies usually focused on only few types of risks such as overexploitation, pollution, etc. Hence, these studies did not compare various risk types and give them priority ranks for the better management of fisheries sector in Baluchistan, Pakistan. Thus, this first time study aims to fill this gap by using MCDM technique through AHP.
MATERIALS AND METHODS
Data collection: In order to gather numerical data for this proposed study, questionnaire survey was conducted from 1 September 2019 to 26 December 2019. The main objective of this study was to identify risk types and find priority ranks faced by the Baluchistan fisheries, Pakistan. For this purpose, questionnaire was designed which was filled by fishery experts located in various costal districts of the Baluchistan. Face-to-face interviews, by using questionnaire, were conducted to ensure dependability and accuracy of data. Details of the survey participants are presented in Table 1. In total, 31 completed questionnaires were collected. Statistical data obtained through questionnaire was analyzed by using the Analytic Hierarchy Process (AHP) Expert Choice 2000 software. Questionnaires having consistency ratio (CR) more than 0.1 were rejected. Out of 31 questionnaires, 4 questionnaires exhibited CR ratio more than 0.1, hence, were rejected. However, remaining 27 questionnaires were statistically evaluated and the results obtained were considered for this study (Chakraborty and Banik, 2006; Saaty, 1977, 1980).
Data analysis: AHP uses a linear additive model and the axiom independence technique. Among all the options, i.e., risk types pairwise comparisons were made to compute scores and weights. The process of AHP analysis was done in four steps, which are described as follows:
If there are m objectives to compare, the AHP performs the multi-objective decision-making process as follows:
a. Develop the following (n×n) pairwise comparison matrix A for n objectives.
 (1) (1)
(Albayrak and Erensal, 2004)
It is necessary to mention that aij indicates how much more important the ith objective is than the jth objective, while making the suitable material handling equipment selection decision. For all i and j, it is necessary that aii = 1 and aij = 1/aji. The possible assessment values, 1 to 9, of aij in the pairwise comparison matrix represented different interpretations. If the value of aij = 1, it means equal importance of i and j, whereas, if it is = 2, it represents between equal and weak importance of i over j. Likewise, if aij = 3, it denotes weak importance of i over j. In the same way, other values of aij, i.e., 4, 5, 6, 7, 8 and 9 represented between weak and strong importance of i over j, strong importance of i over j, between strong and demonstrated importance of i over j, demonstrated importance of i over j, between demonstrated and absolute importance of i over j and absolute importance of i over j, in that order.
b. Divide each entry in column j of A by the sum of the entries in column j. This results in a new matrix, Aw, in which the sum of the entries in each column will be 1.
 (2) (2)
(Albayrak and Erensal, 2004)
c. Compute ci as the average of the entries in row i of Aw to yield the column vector C.
 (3) (3)
(Albayrak and Erensal, 2004)
Where, ci represents the relative degree of importance of the ith objective.
d. Check the consistency of judgments in the pairwise comparison matrix and the sub-steps as follows:
1) Compute A.C.
 (4) (4)
(Thirumalaivasan et al., 2003)
2) Compute λmax
 (5) (5)
(Thirumalaivasan et al., 2003)
Where, λmax is the maximum eigenvalue of the pairwise comparison matrix.
3) Compute the consistency index (CI).
 (6) (6)
(Thirumalaivasan et al., 2003)
CR is computed by dividing the CI by a value obtained from a table of Random Consistency Index (RI) Table 2.
 (7) (7)
(Albayrak and Erensal, 2004)
Only the results with CR value 10% or less were accepted and considered for this study (Albayrak and Erensal, 2004; Kurttila et al., 2000; Saaty, 1980).
Research model: Figure 1 is the graphical description of major risk types and their sub-types identified on the basis of collected data. It shows that Baluchistan fisheries is exposed to five major kinds of risks, viz., management, natural, ecological, market, and technical risk. Furthermore, sub-types of risk are also highlighted. Hence, this figure demonstrates research model for this study.
RESULTS
Description of Research Participants: Various aspects related to the survey participants are highlighted in Table 1. Survey participants were fishery professionals. Participants were categorized by title: ‘Senior Research Fellow/Others’ (19 individuals, 70.4% of participants), and ‘Associate Research Fellow/Others’ (8 individuals, 29.6% of participants). Five participants had Ph.Ds. (18.5% of participants), while the remainder (22 individuals) had Masters/Bachelors/Others(81.5% of participants). Twelve participants had work experience of between five to ten years (44.4% of participants), and 15 had more than 10 years (55.6% of participants). Participants’ location varied from Lasbela District (16 individuals, 59.3% of participants), and Gwadar District (11 individuals, 40.7% of participants).
Relative Importance and Priority Ranking of Main Risk Factors: The relative importance and priority ranking of main risk factors are, from most important to least: "management risk" (0.511), "natural risk" (0.256), "ecological risk" (0.124), "market risk" (0.062), and "technical risk" (0.046), with a CR value of less than 0.1, indicating consistency (Table 3).
Relative Importance and Priority Ranking of Risk Sub-Factors: The following section presents relative importance and priority ranking of risk sub-factors.
1)Management Risk: The relative importance and priority ranking of management risks are, from most important to least:"overfishing" (0.614), "operational errors" (0.215), "lack of knowledge" (0.111), and "personal injury" (0.060), with a CR value of less than 0.1, indicating consistency.
2) Natural Risk: The relative importance and priority ranking of natural risks are, from most important to least:"oceanic climate changes" (0.765), "natural disasters" (0.153), and "temperature" (0.083), with a CR value of less than 0.1, indicating consistency.
3) Ecological Risk: The relative importance and priority ranking of ecological risks are, from most important to least:"habitat degradation" (0.586), "troubled water(pollution)" (0.248), "hazardous inorganic" (0.116), and "exotic species" (0.050), with a CR value of less than 0.1, indicating consistency.
4) Market Risk: The relative importance and priority ranking of market risks are, from most important to least:"cost fluctuation" (0.590), "price fluctuation" (0.241), and "asymmetric market information" (0.169), with a CR value of less than 0.1, indicating consistency.
5) Technical Risk: The relative importance and priority ranking of technical risks are, from most important to least:"irrational fishing gear" (0.587), "emissions" (0.209), "equipment failure" (0.140), and "infectious diseases" (0.064), with a CR value of less than 0.1, indicating consistency.
Overall Relative Importance of all the Sub-Factors: After considering the main factors, the overall importance and priority ranking of sub-factors are, from most important to least:"overfishing" (0.314), "oceanic climate changes" (0.196), "operational errors" (0.110), "habitat degradation" (0.073), "lack of knowledge" (0.057), and "natural disasters" (0.039), with a CR value of less than 0.1, indicating consistency Table 4.
Table 1. Frequency analysis of research participants.
Status(사회적지위)Associate Research Fellow/OthersEducation (교육)Masters/Bachelor/OthersWorking experience(근무경험)More than 10 yearsRegion (지역)Gwadar District
|
Categories
|
Frequency
|
Percentage
|
|
Status
|
Senior Research Fellow/Others
|
19
|
70.4
|
|
8
|
29.6
|
|
Education
|
Ph.D.
|
5
|
18.5
|
|
22
|
81.5
|
|
Working experience
|
Between 5 to 10 years
|
12
|
44.4
|
|
15
|
55.6
|
|
Region
|
Lasbela District
|
16
|
59.3
|
|
11
|
40.7
|
|
Total
|
27
|
100.0
|
Table 2. Random consistency index (RI).
|
n
|
2
|
3
|
4
|
5
|
6
|
7
|
8
|
9
|
10
|
|
RI
|
0
|
0.58
|
0.90
|
1.12
|
1.24
|
1.32
|
1.41
|
1.45
|
1.51
|
Table 3. Calculated relative importance and priority ranking of main risk factors.
|
Risk Factors
|
Importance
|
Ranking
|
|
Management risk
|
0.511
|
1
|
|
Natural risk
|
0.256
|
2
|
|
Ecological risk
|
0.124
|
3
|
|
Market risk
|
0.062
|
4
|
|
Technical risk
|
0.046
|
5
|
|
CR
|
0.027
|
Table 4. Relative importance analysis results of sub-risk factors.
|
Evaluation Area
|
Importance
|
Ranking
|
|
Lack of knowledge
|
0.057
|
5
|
|
Personal injury
|
0.031
|
9
|
|
Overfishing
|
0.314
|
1
|
|
Operational errors
|
0.110
|
3
|
|
Oceanic Climate changes
|
0.196
|
2
|
|
Temperature
|
0.021
|
11
|
|
Natural disasters
|
0.039
|
6
|
|
Exotic species
|
0.006
|
17
|
|
Habitat degradation
|
0.073
|
4
|
|
Troubled Water(pollution)
|
0.031
|
8
|
|
Hazardous inorganic
|
0.014
|
13
|
|
Price fluctuation
|
0.015
|
12
|
|
Cost fluctuation
|
0.036
|
7
|
|
Asymmetric Market information
|
0.010
|
14
|
|
Irrational Fishing gear
|
0.027
|
10
|
|
Equipment failure
|
0.006
|
16
|
|
Emissions
|
0.010
|
15
|
|
Infectious diseases
|
0.003
|
18
|
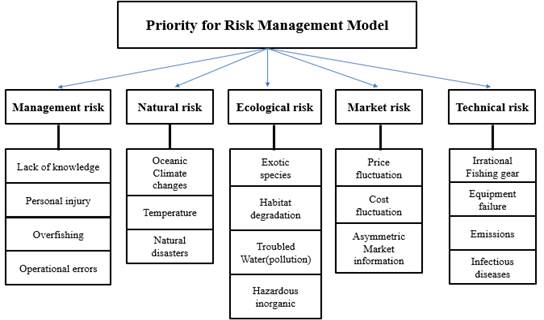
Fig. 1. Graphical description of research model.
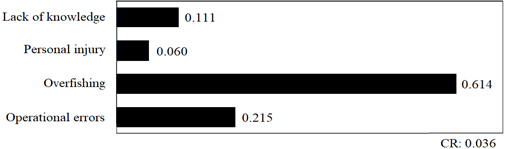
Fig. 2. Relative importance and priority ranking of management risk sub-factors.
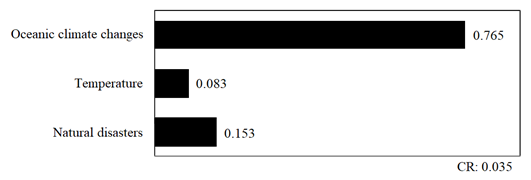
Fig. 3. Relative importance and priority ranking of natural risk sub-factors.
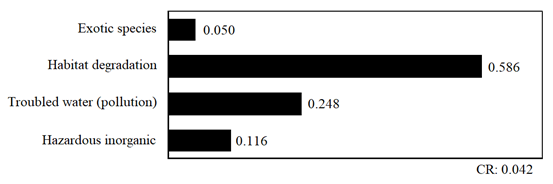
Fig. 4. Relative importance and priority ranking of ecological risk sub-factors.
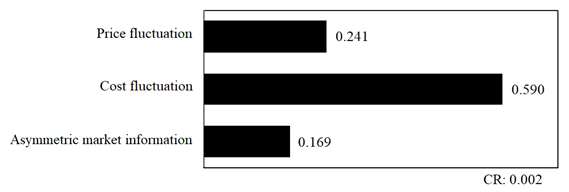
Fig. 5. Relative importance and priority ranking of market risk sub-factors.
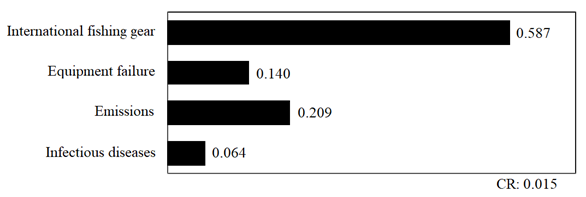
Fig. 6. Relative importance and priority ranking of technical risk sub-factors.
DISCUSSION
This study finds that overexploitation is the biggest risk faced by the Baluchistan fisheries, Pakistan. This result is consistent with many previously conducted studies. Such as, Mohsin et al. (2017) found that Parapenaeopsis stylifera is experiencing overexploitation risk. As a result of this risk its fishery stock is decreasing gradually. Likewise, similar results were obtained by Memon et al. (2017) for Acanthopagrus berda fishery resource. The list does not stop here rather many other studies also declare overexploitation a big risk faced by many important commercial fisheries of Pakistan (Baset et al., 2017; Mehak et al., 2018). However, other types of risks confronted by the fisheries sector in Pakistan are also reported in the published literature (Farooqi, et al., 2005; Haq, 1997; Iqbal et al., 2013; Ahmed and Bat 2015). According to the findings of this study, Baluchistan fisheries is experiencing many types of risks, viz., management risk, natural risk, ecological risk, market risk and technical risk. Thus, it is necessary to discuss how these risks can be managed. Avoiding risk is the best option generally considered to deal with the risk. In the science of risk management, this strategy of coping risk is known as Precautionary Principal (Farrow, 2004). This simple method of dealing with risk involves risk evaluation, in terms of cost and benefit. If benefit supersedes cost, in this condition certain decision regarding risk management is made (Sethi, 2010). Practically speaking, most of the time cost and benefit cannot be estimated exactly. In such specific conditions, Precautionary Principle is applied, however, after considering some definite evidence. This evidence should prove that specific action is harmless (Foster et al., 2000). Because of these simple and promising logics of the Precautionary Principle most of the risk management plans follow this principle (Garcia, 1994; FAO, 1996). Conservation of fisheries population is also a focus of this principle (Restrepo and Powers, 1999). Furthermore, this principle also endorses to safeguard socioecological systems (Charles, 2002; Gerrodette et al., 2002).
Nowadays, there is a growing trend of managing fisheries biologically and economically at the same time (Hilborn, 2007). In order to accomplish this, usually the option of risk transfer is used. This approach involves transfer of risk to another party by assuming that another party will handle the risk in a more efficient way, which is termed as Pareto Efficiency (Sethi, 2010; Ahsan et al., 1982). However, the party to which risk is transferred receives insurance premium because of its risk bearing ability (Sethi, 2010). However, risk management by using the mechanism of Pareto Efficiency is not common, particularly, in developing countries. This risk management practice is mostly practiced in the developed countries (State of Alaska, 1951; Hotta, 1999). However, such kind of management practice can be used in Pakistan to manage fisheries. Occasionally, fisheries management is done by using diversification and portfolio method. This methods involves the clustering of fishery assets such as inter alia, fish species, financial securities, etc., into various groupings. The groups are compared with each other in terms of their management efficiency and those groups are selected for management practice, which are thought to deliver the best management (Roy, 1952). In order to recognize the best management group for management a specific analysis, viz., portfolio analysis is done. Through this analysis various parameters are computed. Among different outputs, efficiency frontier is the most important and crucial for recognizing the best group (Sethi, 2010). Several published studies employ diversification and portfolio methods for managing fisheries (Lehman and Tilman 2000; Markowitz, 1999; Koellner and Schmitz, 2006).
Some researchers suggest risk budgeting or value-at-risk for managing harvesting of fish species (Pearson, 2002). Fisheries sector is also confronted by the market risk. This risk is because of the variation of fish price, which directly affects the revenue (RMA, 1997). It is reported that market risk makes fishery business more challenging because under its pressure stakeholders become reluctant to sponsor new fishing gears or processing facilities (Larson et al., 1998; Sethi, 2010). Pakistani fisheries sector is also a victim of market risk. In order to cope with market risk several methods are used. These methods include enterprise integration, forward contracting, and market timing (Patrick, 1992). By applying these methods, sellers and buyers can sign contracts to fix price for the future dealings. Such a condition will definitely result in the price stability and more conducive business environment. Another method, viz., hedging price movement can also be used to encounter market risk (Catlett and Libbin, 2007). Stable fish supply to the market by observing market time, enterprise amalgamation though horizontal and vertical integration, and internalization are considered to be effective ways to deal with this type of risk (Cheung, 1983; Townsend et al., 2008).
The technique used in this study, i.e., AHP has some drawbacks. Such as, AHP scale is considered ridiculous by some researchers. Moreover, AHP technique can only be utilized to evaluate the definite figures. Occasionally, the results are vague and cannot be expressed in the form of numbers. Thus, in such circumstances, the use of AHP is not precise. In addition to this, AHP technique uses only direct data models. In these models, yield and information are dependent to each other. It cannot bifurcate yield and information into different independent groups like straight models. It only follows stakeholder’s direction and neglect dangers and potential uncertainties (Karthikeyan et al., 2016). It has no ability to identify tradeoffs accurately and their relative magnitude (Zhu et al., 2005). Some researchers also think that AHP prioritization method is not adequate (Sobczak and Berry, 2007).
Findings of this study can be used for the better and effective fisheries management. This study reveals that Baluchistan fisheries is exposed to five different kinds of risks, viz., management risk, natural risk, ecological risk, market risk, and technical risk. According to AHP analysis, relative importance and priority ranking of all the risks studied, from the most important to the least important, is ‘management risk’ (0.511), ‘natural risk’ (0.256), ‘ecological risk’ (0.124), ‘market risk’ (0.062), and ‘technical risk’ (0.046). Among risk sub-factors, ‘overfishing’ (0.314) is the most important, whereas, ‘infectious disease’ (0.005) is the least important. In order to encounter these risks and strengthen fisheries sector, national fisheries policy of 2007 is the prime and key regulation in Pakistan. It deals with diverse types of risks faced by fisheries sector. It also focuses on overexploitation through the regulations written in strategy axis 2.A of this policy (GoP, 2007). Pakistan is signatory to FAO and it should strive to improve its fisheries sector (FAO, 1995). In this regard, recent efforts made by public and private are remarkable, however, still some studies indicate overexploitation of fisheries resources (Baset et al., 2017; Mehak et al., 2018). It is suggested to improve inter-departmental coordination to improve this situation. Fisheries managers should play their key role and should ensure proper implementation of existing policies. Use of smaller mesh size and fishing during a banned season should be observed strictly. It is also recommended to study each risk type in greater detail and formulate policy to control that risk type in an effective way.
Acknowledgments: The authors are very grateful to Zhejiang YueXiu University of Foreign Languages, Education of Zhejiang Province (Grant No: Y202043909) and MOE Foundation of Humanities and Social Sciences (Grant No: 19YJCGJW011) for funding this study.
REFERENCES
- Ahmed, F. E., D. Hattis, R. E. Wolke, and D. Steinman, (1993). Human health risks due to consumption of chemically contaminated fishery products. Environ. Health Perspect. 101: 297-302.
- Ahmed, Q., and L. Bat (2015). Heavy metal levels in Euthynnus affinis (Cantor 1849) Kawakawa fish marketed at Karachi fish harbor, Pakistan and potential risk to human health. J. Black Sea/Mediterr Environ. 21: 35-44.
- Ahsan, S.M., A.A.G. Ali, and N.J. Kurian (1982). Toward a theory of agricultural insurance. Am. J. Agr. Econ. 64: 520-529.
- Albayrak, E., and Y.C. Erensal (2004). Using analytic hierarchy process (AHP) to improve human performance: an application of multiple criteria decision making problem.J. Intell. Manuf. 15: 491-503.
- Baset, A., Q. Liu, M.T. Hanif, B. Liao, A.M. Memon and M. Mohsin (2017). Estimation of maximum sustainable yield using production modeling: a stock appraisal of Indian oil sardine (Sardinella longiceps) from Pakistani waters. Pak. J. Zool. 49: 521-528.
- Caddy, J.F., and R. Mahon (1995). Reference points for fisheries management. FAO Fisheries and Aquaculture Department. Retrieved from: http://www.fao.org/3/v8400e/v8400e00.htm.
- Catlett, L.B., and J.D. Libbin (2007). Risk management in agriculture: a guide to futures, options, and swaps. 1st Ed. Thomson Delmar Learning; New York. 207 p.
- Chakraborty, S., and D. Banik (2006). Design of a material handling equipment selection model using analytic hierarchy process. Int. J. Manuf. Tech. 28: 1237-1245.
- Charles, A.T. (1998). Living with uncertainty in fisheries: analytical methods, management priorities and the Canadian ground fishery experience. Fish. Res.37: 37-50.
- Charles, A.T. (2002). The precautionary approach and ‘burden of proof’ challenges in fishery management. B. Mar. Sci. 70: 683-694.
- Cheung, S.N.S. (1983). The contractual nature of the firm. J. Law. Econ. 26: 1-21.
- Dong, F. Y., and L. Xu, (2003). Cause analysis and management strategies on fisheries risk. Chinese Fish. Econ. 05: 31-33.
- Efron, B. (1979). Computers and the theory of statistics: thinking the unthinkable. Siam. Rev. 21: 460-480.
- FAO (1995). Code of conduct for responsible fisheries. FAO Fisheries and Aquaculture Department. 1-41 p.
- FAO (1996). Precautionary approach to capture fisheries and species introductions. FAO Fisheries and Aquaculture Department. Technical Paper No. 2. 1-53 p.
- Farooqi, A.B., A.H. Khan, and H. Mir (2005). Climate change perspective in Pakistan. Pak. J. Meteorol. 2: 11-21.
- Farrow, S. (2004). Using risk assessment, benefit-cost analysis and real options to implement a precautionary principle. Risk Anal. 24: 727-735.
- Foster, K. R., P. Vecchia, and M. H. Repacholi, (2000). Risk management: science and the precautionary principle. Science. 288: 979-981.
- Francis, R., and R. Shotton (1997). ‘‘Risk’’ in fisheries management: a review. Can. J. Fish. Aquat. Sci. 54: 1699-1715.
- Garcia, S.M. (1994). The precautionary principle: its implications in capture fisheries management. Ocean Coast. Manage. 22: 99-125.
- Gerrodette, T., P.K. Dayton, S. Macinko, and M.J. Fogarty (2002). Precautionary management of marine fisheries: moving beyond burden of proof. B. Mar. Sci. 70: 657-668.
- GoP (2007). National policy and strategy for fisheries and aquaculture development in Pakistan. Ministry of Food, Agriculture and Livestock. Govt. Pakistan, Islamabad. Retrieved from: http://faolex.fao.org/docs/pdf/pak150786.pdf.
- Gray, T., and J. Hatchard, (2008). A complicated relationship: stakeholder participation and the ecosystem-based approach to fisheries management. Mar. Pol. 32: 158-168.
- Hanna, S.S. (1997). The new frontier of American fisheries governance. Ecol. Econ. 20: 221-233.
- Haq, B.U., G. Kullenberg, and J.H. Stel (1997). Coastal zone management imperative for maritime developing nations. Coastal Systems and Continental Margins. Springer; New York. 394 p.
- Hilborn, R. (2007). Moving to sustainability by learning from successful fisheries. Ambio. 36: 296-303.
- Hirshleifer, J., (1992). The analytics of uncertainty and information. Cambridge surveys of economic literature. Cambridge University Press, Cambridge, UK.
- Holley, J. R., K. A. McComas, and M. P. Hare, (2018). Troubled waters: risk perception and the case of oyster restoration in the closed waters of the Hudson-Raritan estuary. Mar. Pol. 91: 104-112.
- Horwood, J. (1993). Stochastically optimal management of fisheries. ICES CM D:26. ICES, Copenhagen.
- Hotta, M. (1999). Fisheries insurance programmes in Asia: experiences, practices and principles. FAO Fisheries and Aquaculture Department. Retrieved from: http://www.fao.org/3/x4363e/x4363e00.htm.
- Iqbal, Z., K. Pervaiz and M.N. Javed (2013). Population dynamics of Tor macrolepis (Teleostei: Cyprinidae) and other fishes of Attock region, Pakistan. Can. J. Pur. App. Sci. 7: 2195-2201.
- Karthikeyan, R., K.G.S. Venkatesan, and A. Chandrasekar (2016). A comparison of strengths and weaknesses for analytical hierarchy process. J. Chem. Pharm. Sci. 9: 12-15.
- Kasperski, S., and D. S. Holland, (2013). Income diversification and risk for fishermen. P. Natl. Acad. Sci. USA. 110: 2076-2081.
- Kiran, N., Y.T. Mu, H. Khadim, K.M. Ali, M. Mohsin, H. Shamsher, K. Selly, Z. Sun, and N. An (2017). Bioindicators are at danger along Karachi coast affecting economy in Pakistan. Indian J. Geo-Mar Sci. 45: 230-232.
- Kjaersgaard, J. (2007). Multiple criteria decision making in fisheries management: experiences and implications. Acta. Agr. Scand. 4: 49-64.
- Koellner, T., and O.J. Schmitz (2006). Biodiversity, ecosystem function and investment risk. BioScience. 56: 977-985.
- Kurttila, M., M. Pesonen, J. Kangas, and M. Kajanus (2000). Utilizing the analytic hierarchy process AHP in SWOT analysis - a hybrid method and its application to a forest-certification case. Forest Policy Econ. 1: 41-52.
- Larson, D.F., P. Varangis, and N. Yabuki (1998). Commodity risk management and development. The World Bank, Washington.
- Lehar, A. (2005). Measuring systematic risk: a risk management approach. J. Bank. Financ. 29: 2577-2603.
- Lehman, C.L., and D. Tilman (2000). Biodiversity, stability, and productivity in competitive communities. Am. Nat. 156: 534-552.
- Leung, P. (2006). Multiple-criteria decision making (MCDM) applications in fishery management. Int. J. Environ. Tech. Manage. 6: 96-100.
- Linkov, I., F.K. Satterstrom, G. Kiker, C. Batchelor, T. Bridges, and E. Ferguson (2006). From comparative risk assessment to multi-criteria decision analysis and adaptive management: recent developments and applications. Environ. Int. 32: 1072-1093.
- Markowitz, H.M. (1999). The early history of portfolio theory: 1600-1960. Financ. Anal.J. 55: 5-16.
- Mehak, A., Y.T. Mu, M. Mohsin, A.M. Memon (2018). Bioeconomic analysis and management aspects of metapenaeus shrimp fisheries in Pakistan. Indian J. Geo-Mar. Sci. 47: 1413-1419.
- Memon, A.M., Q. Liu, W.A. Baloch, K.H. Memon, M. Mohsin, E. Karim, and B. Liao (2017). Assessment of maximum sustainable yield of Acanthopagrus berda from Pakistani marine waters by applying surplus production models. Indian J. Geo-Mar. Sci. 46: 1410-1416.
- Mendoza, G.A., and H. Martins (2006). Multi-criteria decision analysis in natural resource management: a critical review of methods and new modeling paradigms. Forest. Ecol. Manag. 230: 1-22.
- Mohsin, M., D. Guilin, C. Zhuo, Y. Hengbin, and M. Noman (2019). Maximum sustainable yield estimates of carangoides fishery resource in Pakistan and its bioeconomic implications. Pakistan J. Zool. 51: 279-287.
- Mohsin, M., Y.T. Mu, A.M. Memon, M.T. Kalhoro, and S.B.H. Shah (2017). Fishery stock assessment of Kiddi shrimp (Parapenaeopsis stylifera) in the Northern Arabian sea coast of Pakistan by using surplus production models. Chin. J. Oceanol. Limn.35: 936-946.
- Noman, M., Y.T. Mu, Y. Zhu, M. Mohsin, A.M. Memon, and S.B.H. Shah (2018). Maximum sustainable yield estimate of shellfish fishery in Chinese marine waters by using surplus production modelling approach. Indian J. Geo-Mar Sci. 47: 1774-1781.
- Noman, M., Y.T. Mu, M. Mohsin, A.M. Memon, and M.T. Kalhoro (2019). Maximum sustainable yield estimates of Scomberomorus sp. from Baluchistan, Pakistan. Pakistan J. Zool. 51: 2199-2207.
- Outreville, J.F. (1998). Theory and practice of insurance. Springer; New York. 340 p.
- Patrick, G.F. (1992). Managing risk in agriculture. Purdue University Cooperative Extension Service. Purdue University, West Lafayette.
- Pearse, P.H., and C.J. Walters (1992). Harvesting regulation under quota management systems for ocean fisheries. Mar. Pollut. 16: 167-182.
- Pearson, N.D. (2002). Risk budgeting: portfolio problem solving with value-at-risk. Wiley; New York. 256 p.
- Punt, A.E. (2006). The FAO precautionary approach after almost 10 years: have we progressed towards implementing simulation-tested feedback-control management systems for fisheries management? Nat. Resour. Model. 19: 441-464.
- Punt, A.E., and R. Hilborn (1997).Fisheries stock assessment and decision analysis: the Bayesian approach. Rev. Fish. Biol. Fisher. 7: 35-63.
- Restrepo, V.R., and J.E. Powers (1999). Precautionary control rules in U.S. fisheries management: specification and performance. ICES J. Mar. Sci. 56: 846-852.
- RMA (1997). Introduction to risk management. Understanding agricultural risks: production, marketing, financial, legal, human Resources. Risk Management Agency. United States Department of Agriculture, Washington.
- Roy, A. D. (1952). Safety first and the holding of assets. Econometrica. 20: 431-449.
- Saaty, T. L. (1977). A scaling method for priorities in hierarchical structures. J. Math. Psychol. 15: 234-281.
- Saaty, T. L. (1980). The analytic hierarchy process. McGraw-Hill; New York.
- Saaty, T. L. (1990). The analytic hierarchy process: planning, priority setting, resource allocation. McGraw-Hill; New York. 1-287 p.
- Sethi, S. A. (2010). Risk management for fisheries. Fish. Fish.11: 341-365.
- Sobczak, A., and D.M. Berry (2007). Distributed priority ranking of strategic preliminary requirements for management information systems in economic organizations. Inform. Software Tech. 49: 960-984.
- State of Alaska (1951). Fishermen’s Fund. Alaska Administrative Code 8 AAC 055.010. State of Alaska, Juneau.
- Stephenson, R.L., and D.E. Lane (1995). Fisheries management science: a plea for conceptual change. Can. J. Fish. Aquat. Sci. 52: 2051-2056.
- Thirumalaivasan, D., M. Karmegam, and K. Venugopal (2003). AHP-DRASTIC: software for specific aquifer vulnerability assessment using DRASTIC model and GIS. Environ. Modell. Softw. 18: 645-656.
- Tong, C. F., and J. Li, (2011). The necessity and feasibility of implementing policy-based fishery insurance system. J. Xi'an Univ. Financ. Econ. 24: 47-50.
- Townsend, R., R. Shotton, and H. Uchida (2008). Case studies in fisheries self-governance. FAO Fisheries and Aquaculture Department. Technical Paper No. 504. 1-451 p.
- Walters, C.J., and P.H. Pearse (1996). Stock information requirements for quota management systems in commercial fisheries. Rev. Fish. Biol. Fisher. 6: 21-42.
- Wan, C. D., and C. J. Chen, (2011). Supply chain risk and its control strategy of aquatic product processing industry. Commerc. Res. 1: 17-21.
- Zahedi, F. (1986). The analytic hierarchy process-a survey of the method and its applications. Interfaces. 16: 96-108.
- Zhang, D., and Y. Zheng, (2016). The role of price risk in China’s agricultural and fisheries exports to the US. Appl. Econ. 48: 3944–3960.
- Zhu, L., A.K. Aurum, I. Gorton, and R. Jeffery (2005). Tradeoff and sensitivity analysis in software architecture evaluation using analytic hierarchy process. Software Qual. J. 13: 357-375.
|


