ASSESSMENT OF PHENOTYPIC DIVERSITY OF BARLEY GENOTYPES THROUGH CLUSTER AND PRINCIPAL COMPONENT ANALYSES
M. J. Y. Shtaya1* and J. M. Abdallah2
1 Department of Plant Production and Protection, Faculty of Agriculture and Veterinary Medicine, An-Najah National University, P.O. Box 7, Nablus, Palestine.
2 Department of Animal Production, Faculty of Agriculture and Veterinary Medicine, An-Najah National University, P.O. Box 7, Nablus, Palestine.
* Corresponding author E-mail: mshtaya@najah.edu
ABSTRACT
Determination of genetic diversity is useful for plant breeding and hence production of more efficient plant varieties under different conditions. Accordingly, a collection of 74 accessions of landraces and cultivated varieties of barley from different countries, mainly from the Fertile Crescent were selected, grown and analyzed for phenotypic diversity. The field experiment was conducted at the experimental farm of the Faculty of Agriculture, An-Najah National University, Tulkarm (Khadouri), Palestine in a randomized complete block design with three replications. Initially, an analysis of variance (ANOVA) was conducted to test for significant differences among barley accessions in measured traits. A two-step cluster analysis was performed using the eleven measured traits to determine the optimal number of clusters based on Shwarz’s Bayesian Criterion (BIC) then, a dendrogram was constructed using the Hierarchical Cluster analysis with Ward’s clustering method based on Squared Euclidean Distances. ANOVA revealed highly significant differences among barley accessions in all studied traits. Based on Principal Component Analysis (PCA), the first four extracted components explained 76.1% of the total variation in the 11 studied traits. The clustering analyses revealed two main clusters each can be further divided into two sub-clusters. The first cluster included 41 accessions and the second cluster included 33 accessions. Such variation among studied accessions can be utilized in designing new breeding programs and crossing nurseries for barley improvement.
Key words: Cluster analysis, Hordeum vulgare, PCA, Selection, Barley
https://doi.org/10.36899/JAPS.2021.5.0336
Published online January 21, 2021
INTRODUCTION
Barley (Hordeum vulgare L.) is one of the most important cereals currently cultivated in the world. It is considered as one of the main important sources of protein and calories in human diet. Historically, barley is one of the oldest domesticated grains in the world. Its cultivation started between 9500 and 8400 years ago and it played a vital role in the revolution of civilizations by providing food to humans and animals (Azhaguvel and Komatsuda, 2007). Barley, wheat and several pulses (grain legumes) were originated in the ‘Fertile Crescent’, specifically Palestine -Jordan area. This area is the region in which barley was brought into culture and then spread through Syria and Lebanon to northern Iraq and Iran (Preece et al., 2016).
Breeding for high yielding varieties generally leads to reduce genetic diversity that can change gene frequencies of plant material (Malik et al., 2013). Knowledge regarding the amount of variation in germplasm arrays and relationships between genotypes are important considerations for efficient conservation and utilization of genetic resources (Russel et al., 1997; Davila et al., 1998 and Manjunatha et al., 2006). In the context of plant improvement, this information provides a basis for making decisions regarding selection of parental combinations that amount of genetic variation present, and the location of the genetic determinants of diversity may be useful for germplasm conservation and targeting gene discovery efforts (Sorrels and Wilson, 1997; Jana, 1999 and Hou et al., 2005). It is, therefore, important to study variability in plant genotypes to meet the diversified goals such as increasing yield, wider adaptation, desirable quality, and pests and disease resistance (Fufa et al., 2005). Growing numbers of candidate varieties and the decrease in variability in morphological traits has led to the establishment of evaluation procedures to discriminate accessions during germplasm evaluation (Aghaee et al., 2010).
Multivariate analysis is the most commonly used approach to illuminate the patterns of variation in germplasm collections. Among multivariate techniques, PCA and cluster analysis are preferred tools for morphological characterization of genotypes and their grouping on similarity basis (Mohammadi and Prasanna, 2003 and Peeters and Martinelli, 1989). Combination of these two approaches give comprehensive information of characters which are critically contributing for genetic variability in crops (Rachovska et al., 2003). The present study was undertaken with the objective to assess and evaluate the diversity of 74 accessions of barley based on agro-morphological traits.
MATERIALS AND METHODS
Plant Material: A collection of 74 accessions of landraces and cultivated varieties of barley from different countries, mainly from the Fertile Crescent, kindly provided by Dr. Maria von Korff, Max-Planck Institute for Plant Breeding, Germany, was used in the experiment (Table 1).
Table 1: Barley accessions used in the study.
|
NO
|
Code/name
|
NO
|
Code/name
|
NO
|
Code/name
|
NO
|
Code/name
|
|
1
|
MK_RB_18
|
20
|
MK_RB_183
|
39
|
MK_RB_246
|
58
|
LR1897
|
|
2
|
MK_RB_21
|
21
|
MK_RB_184
|
40
|
MK_RB_268
|
59
|
Barke
|
|
3
|
MK_RB_86
|
22
|
MK_RB_186
|
41
|
MK_RB_269
|
60
|
Lr761
|
|
4
|
MK_RB_87
|
23
|
MK_RB_187
|
42
|
MK_RB_270
|
61
|
Optic
|
|
5
|
MK_RB_94
|
24
|
MK_RB_188
|
43
|
MK_RB_271
|
62
|
HID44
|
|
6
|
MK_RB_107
|
25
|
MK_RB_189
|
44
|
MK_RB_278
|
63
|
HID52
|
|
7
|
MK_RB_113
|
26
|
MK_RB_190
|
45
|
MK_RB_279
|
64
|
HID301
|
|
8
|
MK_RB_114
|
27
|
MK_RB_192
|
46
|
MK_RB_281
|
65
|
LR1043
|
|
9
|
MK_RB_118
|
28
|
MK_RB_223
|
47
|
MK_RB_282
|
66
|
Marthe
|
|
10
|
MK_RB_147
|
29
|
MK_RB_224
|
48
|
MK_RB_284
|
67
|
Bowman
|
|
11
|
MK_RB_150
|
30
|
MK_RB_225
|
49
|
MK_RB_286
|
68
|
BW281
|
|
12
|
MK_RB_152
|
31
|
MK_RB_227
|
50
|
Mutha
|
69
|
BW284
|
|
13
|
MK_RB_154
|
32
|
MK_RB_228
|
51
|
Rum
|
70
|
BW285
|
|
14
|
MK_RB_155
|
33
|
MK_RB_229
|
52
|
Aksad
|
71
|
BW287
|
|
15
|
MK_RB_156
|
34
|
MK_RB_230
|
53
|
Keel
|
72
|
BW289
|
|
16
|
MK_RB_157
|
35
|
MK_RB_232
|
54
|
Flagship
|
73
|
BW290
|
|
17
|
MK_RB_163
|
36
|
MK_RB_233
|
55
|
Morex
|
74
|
G400
|
|
18
|
MK_RB_167
|
37
|
MK_RB_240
|
56
|
Auriga
|
|
|
19
|
MK_RB_181
|
38
|
MK_RB_241
|
57
|
LR871
|
|
|
Field Experiment: The field experiment was conducted at the experimental farm of the Faculty of Agriculture, An-Najah National University, Tulkarm (Khadouri), Palestine (32.31519º N and 35.02033º W and altitude of 75 m, average mean yearly rainfall 600 mm), during two growing seasons 2015-2016 and 2016-2017 in a triplicated randomized complete block design (RCBD). In each replicate, twenty seeds from each accession were planted in one-meter row. Spacing was 10 cm between plants within row and 70 cm between rows.
Data collection: Observations were recorded on five plants from each replicate on each accession. The traits measured were growth vigor (measured on a scale from 1 = very low to 5 = very high), days to stem elongation, days to heading, days to maturity, number of tillers per plant, spike length (cm), spike number, plant height (cm), vegetative biomass (g), thousand-kernel weight (g) and grain yield per row (g).
Data Analysis
Analysis of Variance (ANOVA): Initially, an analysis of variance (ANOVA) (Fisher, 1918) was conducted using PROC GLM procedure of SAS/STAT software, version 9.0 for Windows (SAS institute 2002) to test differences among barley accessions in measured traits. The analysis model included the effects of year, replicate, and accession. For each trait, the observed means (averages over all replicates and over the two growing seasons) were obtained for each genotype and used in the subsequent analyses.
Principal Component Analysis: Factor analysis with Principal Components (Pearson, 1901 and Hotelling, 1933) was carried out in SPSS (V21.0). KMO (Kaise-Meyer-Olkin Measure of Adequacy) test value of 0.59 and the significant result of Bartlett’s test of Sphericity (P < 0.001) indicated that PCA multivariate analysis is appropriate for the data. Rotated solutions of principal components were obtained using Oblimin with Kaiser Normalization method (Kaiser, 1958; Jennrich and Sampson, 1966; and Clarkson and Jennrich, 1988)
Cluster Analysis: First, a two-step cluster analysis (Chiu et al., 2001 and Bacher et al., 2004) was performed on the barley accessions using the eleven measured traits. This initial analysis was done to determine the optimal number of clusters based on Shwarz’s Bayesian Criterion (BIC) and determine the relative importance of the measured traits in clustering of the studied accessions. Then, a Hierarchical Cluster analysis with Ward’s clustering method (Ward, 1963) based on Squared Euclidean Distances was performed to construct a cluster tree (dendrogram). Student’s t test (Gosset, 1908) was applied to test for differences in means of measured traits between the two main clusters which were revealed by the clustering analyses. Clustering analyses and the t test were all carried out in SPSS (V21.0).
RESULTS AND DISCUSSION
Analysis of Variance: The results from the analysis of variance are in Table 2. The effect of year was highly significant (P < 0.0001) for all traits (except for growth vigor) reflecting high environmental variation between the two growing seasons. The effect of block was not significant except for growth vigor (P < 0.0001), plant height (P = 0.05), spike number (P = 0.004) and thousand-kernel weight (P < 0.0001). The results showed highly significant differences (P < 0.0001) among accessions for all studied traits. This large variation among genotypes could be utilized in selection programs particularly for production traits.
Table 2. Analysis of variance results (mean squares) of data on seventy-four barley accessions. The model included the effects of year, block and accession.
|
Trait
|
Effects fitted in the model
|
|
Year
|
Block
|
Accession
|
|
Mean square
|
P value
|
Mean square
|
P value
|
Mean square
|
P value
|
|
Growth vigor
|
0.036
|
0.85
|
6.29
|
0.002
|
3.11
|
< 0.0001
|
|
Days to stem elongation
|
4314.1
|
< 0.0001
|
176.3
|
0.30
|
1030.6
|
< 0.0001
|
|
Days to heading
|
20229.8
|
< 0.0001
|
18.0
|
0.47
|
1352.9
|
< 0.0001
|
|
Days to maturity
|
31621.6
|
< 0.0001
|
16.3
|
0.44
|
677.5
|
< 0.0001
|
|
Tiller number
|
5874.4
|
< 0.0001
|
29.7
|
0.28
|
99.0
|
< 0.0001
|
|
Spike number
|
3920.8
|
< 0.0001
|
137.49
|
0.004
|
92.3
|
< 0.0001
|
|
Spike length
|
37.9
|
< 0.0001
|
1.3
|
0.10
|
4.4
|
< 0.0001
|
|
Plant height
|
12423.5
|
< 0.0001
|
284.1
|
0.05
|
721.1
|
< 0.0001
|
|
Grain yield
|
262391.4
|
< 0.0001
|
2757.67
|
0.35
|
22637.8
|
< 0.0001
|
|
Thousand-kernel weight
|
371.1
|
< 0.0001
|
128.8
|
< 0.0001
|
202.3
|
< 0.0001
|
|
Vegetative biomass
|
37723015.1
|
< 0.0001
|
232.8
|
0.99
|
297292.2
|
< 0.0001
|
Principal Component Analysis: Although eleven principal components could have been extracted (equal to number of traits), only the first four components were considered important (had Eigenvalues above 1.0). These results are in agreement with the results reported by Maqbool et al. (2010). These four components explained 76.1% of the total variation in the 11 studied traits (Table 3 and Figure 1). The components plot (Figure 2) and the patterns matrix (Table 4) showed the contribution of studied traits to extracted components. Characters with absolute values closer to unity have higher contribution to the components (Chahal and Gosal, 2002).
The first component which explained 27% of the total variation was dominated by three traits with high positive loadings (days to stem elongation, days to heading and days to maturity) and by growth vigor which has a negative contribution. The second component which explained 20% of the total variation was dominated by three traits (tiller number and spike number with positive loadings and plant height with a negative loading). The third component explained 18% of the total variation and had high positive loadings for plant height, grain yield and vegetative biomass. The fourth component explained about 11% of the total variation and had high positive loadings for spike length and thousand-kernel weight. These were the major effective traits that governed the variation in these four components. Chahal and Gosal (2002) and Poudel et al., (2017), stated that characters with largest absolute values closer to unity within the first PC influence the clustering more than those with lower absolute values closer to zero
Table 3. Eigenvalues and percentage of total variance explained by each principal component.
|
Component
|
Initial Eigenvalues
|
Extraction Sums of Squared Loadings
|
|
Total
|
% of Variance
|
Cumulative %
|
Total
|
% of Variance
|
Cumulative %
|
|
1
|
2.973
|
27.024
|
27.024
|
2.973
|
27.024
|
27.024
|
|
2
|
2.222
|
20.200
|
47.224
|
2.222
|
20.200
|
47.224
|
|
3
|
1.980
|
18.003
|
65.227
|
1.980
|
18.003
|
65.227
|
|
4
|
1.195
|
10.862
|
76.089
|
1.195
|
10.862
|
76.089
|
|
5
|
.747
|
6.790
|
82.878
|
|
|
|
|
6
|
.736
|
6.688
|
89.566
|
|
|
|
|
7
|
.537
|
4.879
|
94.445
|
|
|
|
|
8
|
.323
|
2.937
|
97.382
|
|
|
|
|
9
|
.188
|
1.706
|
99.088
|
|
|
|
|
10
|
.063
|
.571
|
99.658
|
|
|
|
|
11
|
.038
|
.342
|
100.000
|
|
|
|
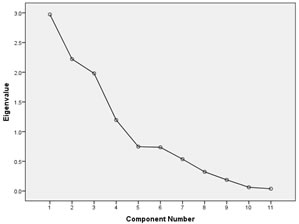
Figure 1. Scree plot of principal components and their Eigenvalues.
Table 4. The pattern matrix from Principal Component Analysis showing the contributions (loadings) of measured traits to the first four extracted components.
|
Trait
|
Principal Component
|
|
1
|
2
|
3
|
4
|
|
Growth vigor
|
-.521
|
-.048
|
.167
|
.287
|
|
Days to stem elongation
|
.822
|
.208
|
-.140
|
.006
|
|
Days to heading
|
.951
|
-.127
|
.110
|
.136
|
|
Days to maturity
|
.951
|
-.101
|
.133
|
.056
|
|
Tiller number
|
-.076
|
.937
|
.071
|
.122
|
|
Spike number
|
.086
|
.947
|
.210
|
.015
|
|
Spike length
|
.089
|
-.019
|
-.226
|
.812
|
|
Plant height
|
.049
|
-.584
|
.478
|
.083
|
|
Grain yield
|
.035
|
.097
|
.931
|
-.007
|
|
Thousand-kernel weight
|
-.052
|
.113
|
.155
|
.703
|
|
Vegetative biomass
|
-.064
|
.066
|
.896
|
-.069
|

Figure 2. Component plot in rotated space showing the contribution of each of the eleven studied traits on barley genotypes (DH = days to heading, DM = days to maturity, DSE = days to stem elongation, GV = growth vigor, GY = grain yield, PH = plant height, SL= spike length, SN = spike number, TKW= thousand-kernel weight, TN= tiller number, VB = vegetative biomass).
Cluster Analysis: The clustering analyses revealed two main clusters each can be further divided into two sub-clusters (Figure 3). The first cluster included 41 accessions and the second cluster included 33 accessions. Similar results were reported in a collection of 133 barley accessions from Pakistan (Zaheer et al., 2008). The two-step cluster analysis showed that days to maturity, days to heading, and days to elongation were the most important traits in clustering the barley accessions (Figure 4) confirming the results from the PCA analysis. Vegetative biomass, grain yield, and growth vigor had moderate importance in clustering the genotypes while the remaining traits (thousand-kernel weight, plant height, tiller number and spike number) were the least important in clustering the studied barley accessions. However, previous research showed that cluster analysis based on PCA is a more precise indicator of differences among wheat genotypes than cluster analysis (not based on PCA) (Khodadadi et al., 2011). Accessions in Cluster 1 had significantly higher means of days to stem elongation, days to heading and days to maturity and significantly lower means of grain yield, growth vigor, spike number, tiller number, thousand-kernel weight, and vegetative biomass (Table 5). Plant height and spike length did not differ between the two clusters. Similar works have been done by Maqbool et al. (2010), Degewione and Alamerew (2013) and Sajjad et al. (2011) for grouping of wheat germplasm by principal component analysis.
Table 5. Means of studied traits by cluster
|
Trait
|
Cluster
|
P value
|
|
1
|
2
|
|
Growth vigor
|
4.2
|
4.9
|
< 0.0001
|
|
Days to stem elongation
|
67.2
|
51.9
|
< 0.0001
|
|
Days to heading
|
103.7
|
83.9
|
< 0.0001
|
|
Days to maturity
|
123.2
|
109.7
|
< 0.0001
|
|
Tiller number
|
21.2
|
23.6
|
0.013
|
|
Spike number
|
17.9
|
19.8
|
0.033
|
|
Spike length, cm
|
8.1
|
7.8
|
0.27
|
|
Plant height, cm
|
71.2
|
75.6
|
0.085
|
|
Grain yield, g
|
125.2
|
185.5
|
< 0.0001
|
|
Thousand-kernel weight, g
|
39.8
|
43.3
|
< 0.0001
|
|
Vegetative biomass, g
|
473.6
|
684.6
|
< 0.0001
|
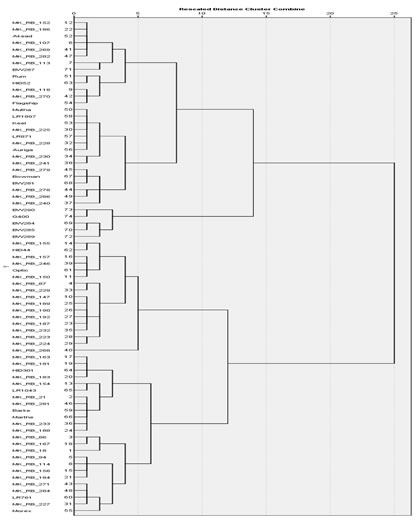
Figure 3. Dendrogram of 74 Barley accessions using the Hierarchical Ward’s clustering method based on 11 measured traits.
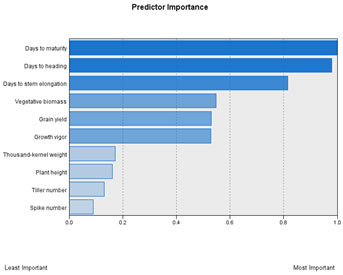
Figure 4. Relative importance of measured traits in clustering of studied genotypes.
Conclusions: The present study showed large amount of variation among studied genotypes for all measured characters indicating that high opportunities exist for genetic improvement of barley genotypes through direct selection and conservation of the germplasm for future utilization. These genotypes can be considered for breeding operations as well as for further study for developing superior barley genotypes. These barley genotypes need to be crossed and selected to develop high yielding pure line varieties.
Acknowledgments: This research was supported by An-Najah National University. The authors gratefully acknowledges Dr. Maria von Korff (Institute for Plant Genetics, Heinrich Heine University Düsseldorf, Germany) for providing seed samples and the excellent technical assistance by the technical team of the experimental farm of the Faculty of Agriculture, An-Najah National University
REFERENCES
- Aghaee, M., R. Mohammadi and S. Nabovati (2010). Agro-morphological characterization of durum wheat accessions using pattern analysis. J. Crop Sci. 4: 505-514.
- Azhaguvel, P. and T. Komatsuda (2007). Aphylogenetic analysis based on nucleotide sequence of a marker linked to the Brittle Rachis Locus indicates a diphyletic origin of barley. Bot. 100:1009–1015.
- Bacher, J., K. Wenzig and M. Vogler (2004). SPSS two step cluster - a first evaluation. Erlangennürnb.1, 1–20
- Chahal, G.S. and S.S. Gosal (2002). Principles and Procedures of Plant Breeding: Biotechnology and Conventional Approaches. Narosa Publishing House. New Delhi, India. pp. 604.
- Chiu, T., D. Fang, J. Chen, Y. Wang and C. Jeris (2001). A robust and scalable clustering algorithm for mixed type attributes in large database environment, in Proceedings of The Seventh ACM SIGKDD International Conference on Knowledge Discovery and Data Mining - KDD ’01, (New York, NY: ACM Press), 263–268.
- Clarkson, D.B. and R.I. Jennrich (1988). Quartic rotation criteria and algorithms. Psychometrika 53, 251–259.
- Davila, J.A., M.P.S. Hoz, Y. Loarce and E. Ferrer (1998). The use of random amplified microsatellite polymorphic DNA and coefficients of parentage to determine genetic relationships in barley. Genome 41: 477-486.
- Degewione, A. and S. Alamerew. (2013). Genetic diversity in bread wheat (Triticum aestivum) genotypes. Pak. J. Biol. Sci. 16: 1330-5
- Fisher, R. A. (1918). The correlation between relatives on the supposition of Mendelian inheritance. Philosophical Transactions of the Royal Society of Edinburgh, 52: 399–433.
- Fufa, H., P.S. Baenziger, B.S. Beecher, I. Dweikat, R.A. Graybosch and K. M. Eskridge (2005). Comparison of phenotypic and molecular marker-based classifications of hard red winter wheat varieties. Euphytica 145: 133-146.
- Gosset, W. S. (1908). The probable error of a mean. Biometrika 6(1): 1–25
- Hotelling, H. (1933). Analysis of a complex of statistical variables into principal components. Educ. Psychol. 24: 417-441.
- Hou, Y.C., Z.H. Yan, Y.M. Wei and Y.L. Zheng (2005). Genetic diversity in barley from West China. Barley Genet. Newsl. 35: 9-22.
- Jana, S. (1999). Some recent issues on the conservation of crop genetic resources in developing countries. Genome 44: 562-569.
- Jennrich, R.I. and P. F. Sampson (1966). Rotation for simple loadings. Psychometrika 31: 313-323.
- Kaiser, H.F. (1958). The varimax criterion for analytic rotation in factor analysis. Psychometrika 23: 187–200.
- Khodadadi, M., M.H. Fotokian and M, Miransari (2011). Genetic diversity of wheat (Triticum aestivum) genotypes based on cluster and principal component analyses for breeding strategies. Aust. J. Crop. Sci. 5: 17-24
- R., H. Sharma, A. Verma, S. Kundu, I. Sharma and R. Chatrath (2013). Hierarchical clustering of Indian wheat varieties using morphological diversity assessment. Indian J. Agric. Res. 47: 116-123.
- Manjunatha, T., I.S. Bisht, K.V. Bhat and B.P. Singh (2006). Genetic diversity in barley (Hordeum vulgare ) landraces from Uttaranchal. Genet. Resour. Crop. Evol. 54: 55-65.
- Maqbool, R., M. Sajjad, I. Khaliq, Aziz-ur- Rehman, A.S. Khan, and S.H. Khan (2010). Morphological diversity and traits association in bread wheat (Triticum aestivum) Am. Eurasian J. Agric. Environ. Sci. 8: 216-224.
- Mohammadi, S.A. and B.M. Prasanna (2003). Analysis of genetic diversity in crop plants-salient statistical tools and considerations. Crop Sci. 43: 1235-1248.
- Pearson, K. (1901). On lines and planes of closest fit to systems of points in space, Philosophical Magazine, Series 6, vol. 2, no. 11, pp. 559-572.
- Peeters, J.P, and J.A. Martinelli (1989). Hierarchical cluster analysis as a tool to manage variation in germplasm collections. Theor. Appl. Genet. 78: 42-48.
- Poudel, A., D.B. Thapa and M. Sapkota (2017). Assessment of genetic diversity of bread wheat (Triticum aestivum) genotypes through cluster and principal component analysis. Inter. J. Exp. Res. Rev. 11: 1-9
- Preece, C., A. Livarda, A. Christin, M. Wallace, G. Martin, M. Charles, G. Jones, M. Rees and P. Osborne (2016). How did the domestication of Fertile Crescent grain crops increase their yields? Ecol. 31: 387–397.
- Rachovska, G., D. Dimova and B. Bojinov (2003). Application of cluster analysis and principal component analysis for evaluation of common winter wheat genotypes. Proceedings of the scientific session of jubilee 2002-Sadovo, volume III: 68-72.
- Russel, J.R., J.D. Fuller, M. Macaulay, B.G. Hatz, A. Jahoor, W. Powell and R. Waugh (1997). Direct comparison of levels of genetic variation among barley accessions detected by RFLP, AFLPs, SSRs and RAPDs. Appl. Genet. 95: 714-722.
- Sajjad, M., S.H. Khan and S.S. Khan (2011). Exploitation of germplasm for grain yield improvement in spring wheat (Triticum aestivum). J. Agric Biol. 13: 695-700.
- SAS Institute (2002). User's Guide. Statistics. Ver.9.0. Cary, N.C.
- Sorrels, M.E. and W.A. Wilson (1997). Direct classification and selection of superior alleles for crop improvement. Crop Sci. 37: 691-697.
- Ward, J. H. (1963). Hierarchical grouping to optimize an objective function. Am. Stat. Assoc. 58, 236–244.
- Zaheer, A., S.U. Ajmal, M. Munir, M. Zubair and M.S. Masood (2008). Genetic diversity for morpho-genetic traits in barley germplasm. J. Bot. 40: 1217-1224.
|


