PHYSIOLOGICAL AND BIOCHEMICAL TRAITS FOR IDENTIFICATION OF SALT TOLERANCE POTENTIAL IN FOUR SORGHUM GENOTYPES
M. Gull1 and A. Kausar2
1Department of Biochemistry, Faculty of Science, King Abdulaziz University, P.O. Box 42805, Jeddah, Kingdom of Saudi Arabia; 2Department of Botany, Government College Women University, Faisalabad, 38000, Pakistan
Corresponding author’s email: munagull@hotmail.com
ABSTRACT
Soil salinity is an alarming problem in the world and major hindrance to agricultural productivity. Adoption of salt tolerant genotypes and screening them in early stages of their growth has become much essential for better growth and yield. This study was conducted to explore the salinity induced changes in water and photosynthetic traits of sorghum cultivars. A sand culture experiment with four sorghum genotypes Sandalbar, JS-2002, Noor and FJ-115 was conducted in earthen pots containing 0 and 100 mM NaCl salinity solutions along with 1/5 Hoaglands nutrient solution. Salinity significantly inhibited leaf water potential in all four sorghum genotypes particularly in Noor and FJ-115 with 0.9 and 0.8 Ψw-MPa respectively. Sandalbar and JS-2002 genotypes maintained higher transpiration rate than FJ-115 and Noor. The maximum inhibition in stomatal conductance was recorded in Noor (1.7 mmol m-2S-1) followed by FJ-115 (2.3 mmol m-2S-1). Under salinity stress, highest decrease in total chlorophyll (52.1%) and soluble sugars (0.26 mg g-1 F.W) contents were found in FJ-115. Salinity stress negatively effected physiological and biochemical traits in all sorghum genotypes that can be used as indicator of their salinity tolerant potential. Sorghum lines JS- 2002 and Sandalbar can be categorized as salinity tolerant while Noor and FJ-115 as sensitive for cultivation. This study could mark a way for determining the degree of salinity tolerance in sorghum cultivars for further utilization in breeding programmes.
Key words: NaCl stress, Leaf water contents, chlorophyll, Biochemicals.
https://doi.org/10.36899/JAPS.2021.4.0295
Published online December 18, 2020
INTRODUCTION
Salinity, drought and high temperatures in the world are major contributing factors leading to decreased crop yields, threatened the sustainability of agricultural areas and worldwide food security (Munns and Tester, 2008). About 7% of the total agricultural lands in the world are affected by salinity and this value may increase up to 20% (Kosova et al., 2013). Salts in the root medium create water imbalance and as a result cause cellular dehydration in plants which inhibits the activities of interacelluar enzymes (O’Donnell et al., 2013). Moreover, agricultural practices like increasing use of low-quality water in irrigation, and massive introduction of irrigation associated with intensive farming have also increased salts in the root medium. Salt stress adversily effects plant growth and inhibits many physiological and biochemical processes in plants, alters the plant metabolism and decline the rate of photosynthesis (Culha and Çakırlar, 2011). Salinity creates ions toxicity by lowering the water potential and hinders the uptake of essential nutrients so creates ionic imbalance in plants and ultimately caused the death of salt sensitive species in saline areas (Ashraf et al., 2008).
Sorghum has key importance with a high tolerance to dry and stressed conditions and showed moderate tolerance to salt stress. It can grow even in water deficiet lands of the world and serves as a model for drought resistance among other agricultural grasses (Sanchez et al., 2002) and it yields better even in harsh environments (Calviño and Messing, 2012). Typically, as drought and dry environments become more severe, senescence of older plant leaves occur as younger leaves of plants possess high rate of photosynthetic and stomatal conductance through elevated rates of osmotic regulation (Jones, 1998; Yang et al., 2020). So, as the net effect, growth remain continued and provide an important source of animal feed under salt or drought stress conditions and reduce the pressure to use other natural resources (Flowers and Yeo, 1995; Gull and Kausar, 2018; Dehnavi et al., 2020).
However, breeding programmes of sorghum have been neglected from last few decades even though sorghum genome has advantageous variable tolerant genes to both biotic and abiotic stresses (Igartua et al., 1995; Roberta et al., 2020). Hence, the development of tolerant sorghum varieties for salt and high temperature is the best approach to enhance the crop productivity in hot, dry climates and saline conditions (Flower et al., 1990; Shakeri et al., 2020). To investigate physiological and biochemical traits related with salt tolerance is an appropriate scientific approach in distinguishing the salt tolerant genotypes for successful breeding with enhanced yield and production. Thus, this study was planned to evaluate the effects of salt stress on some physiological and biochemical traits in sorghum cultivars to be used as an indicator of their salt tolerant potential.
MATERIALS AND METHODS
The project was planned to study some physiological and biochemical characteristics of sorghum genotypes to sodium chloride (NaCl) stress during the year 2017-2018. The experiments were carried out at Department of Botany, Government College University, Faisalabad, Pakistan and Nuclear Institute for Agriculture and Biology (NIAB), Faisalabad, Pakistan.
1.Sorghum genotypes selected for study: The seeds of four sorghum genotypes (Noor, FJ-115, Sandalbar and JS-2002) were collected from Ayub Agricultural Research Institute (AARI), Faisalabad, Pakistan and were utilized to study the mechanism of salt tolerance using 0 (control) or 100 mM NaCl stress. The two-salt tolerant (JS-2002 and Sandalbar) and 2 salt sensitive (Noor and FJ-115) genotypes were selected based on germination and physiological observations previously published by Kausar et al., (2012). For the present study washed river sand after rinsing with distilled water was used.
2. Seed sowing and salinity treatments: Six seeds from each of the genotypes in one pot were sown in earthen glazed pots (diameter; 35 cm) filled with 12 kg of air-dried sand. The seeds of four genotypes were subjected to 0 and 100mm NaCl stress. The pots were arranged in a completely randomized design (CRD) with three replications and re‑positioned during study at various times randomly. After one week of germination all the plants were subjected to 0.15% Hoagland’s nutrient solution in sand culture. This concentration was used to control the electrical conductivity (EC) of nutrient solution and of the rooting zone substrate in an acceptable range (electrical conductivity (EC) of approx. 1.5 dS m-1) to avoid osmotic stress.
The solution of the pots was changed after every week and pH of the solution was maintained at 7.00 with H2SO4 by using pH meter (WTW PH 530). The plants were grown for 120 days under 0 and 100mM concentrations of NaCl in Hoagland ‘s nutrient solution. After that the plants were harvested and various physiological and biochemical parameters recorded. The selection of 0 and 100mm NaCl stress treatments
were based on the established fact that in grasses, tolerance to salinity was found only up to 100 mM. Exposure of grasses upto 150 and 200 mM NaCl caused an increase of NADP-specific isocitrate dehydrogenase (IDH) activity in leaves and roots. Salinity up to 100 mM affect the plant growth but did not significantly affect the content of crude proteins and fibre in leaves of grasses compared with control plants. Whereas at 150 or 200 mM NaCl concentration, the greatest reduction of these crude proteins and fibre values has been observed (Ashraf and Harris, 2004; Zang et al., 2009; Gull and Kausar, 2018; Dehnavi et al., 2020).
Salinity induced physiological traits studied
1. Leaf water potential: The third leaf (fully expanded) from upper top of the two plants from each replication was harvested to record the leaf water potential which was measured at 8-10 a.m with the help of Scholander type pressure chamber.
2.Leaf osmotic potential: The same leaf used for water potential, was frozen in an eppendoff tube for 7 days in a deep-freezer (-20oC), then this frozen leaf was thawed, and cell sap was extracted and used for the determination of osmotic potential through an osmometer (Wescor -5500).
3. Leaf turgor potential: Turgor potential was taken as the difference between leaf water potential (Yw) and osmotic potentials (Ys) values (Kausar et al., 2015). The formula used as follows.
(Yp) = (Yw) - (Ys)
4. Photosynthesis, transpiration and stomatal conductancecharacteristics: Photosynthesis rate as net CO2 assimilation rate (Pn), transpiration rate (E) and stomatal conductance (Gs) were measured by a Photosynthesis system (Portable infrared gas analyzer; Model Cl-340; Analytical development company, Hoddesdon, England). The above data was recorded from 10 a.m to 2 p.m on fully expanded second leaf of each plant. Before recording the data following adjustments were made on Photosynthesis system: Atmospheric pressure 97.9 KPa, air per unit leaf area 403.3 mmol m-2 s-1, temperature of leaf arranged from 28.4 to 32.4oC, ambient temperature ranged from 22.4 to 27.9oC, ambient CO2 concentration 354 µmol mol-1 ,water vapor pressure into chamber ranged from 6.0 to 8.9 mbar and photosynthetically active radiation (PAR) at leaf surface was adjusted maximum upto 1711 mol m-2s-1. Substomatal conductance was calculated by the formula
Ca = Ci – 1.6 PA / Gs
Where Ci= Substomatal conductance, Ca= Ambient CO2 pressure in atmosphere, P= Atmospheric Pressure, A= Photosynthesis rate, Gs= Stomatal conductance (Kausar et al., 2015).
Salinity induced biochemical traits studied
1. Chlorophyll a, b, total chlophyll and carotenoids contents: Chlorophyll contents were determined by using the method given by Arnon (1949) and Davies (1976). To study the chlorophyll contents, fresh leaves used when crop was 60 days old. Reagents used for this analysis were acetone (80%) and distilled water.
Fresh leaves were chopped into small pieces. The chopped leaves (0.5 g) were used for extraction over night in 5 ml of 80% acetone and after extraction spectrophotometer readings were measured at 480, 645 and 663nm. The chlorophyll contents were calculated by following formulae (Kausar and Gull, 2019).
mg of chl. a = [12.7 (OD663) - 2.69 (OD645)] XV
1000 x W
mg of chl. b = [22.9 (OD645) – 4.68 (OD663)] XV
1000 x W
mg of total chl. = [20.2 (OD645) +8.02 (OD663)] XV
1000 x W
Carotenoids (g mL-1) = Acar / Em X 100
Where A car= OD480 + 0.114 (OD663) - 0.638 (OD 645) E100 % cm =2500
V = Volume of sample extract, W = Weight of sample
2. Total soluble sugars: Powdered dried leaves were used for the extraction of total soluble sugars from four sorgum cultivars. Plant material (0.1 g) was incubated for 6 h at 60oC in 80% ethanol solution. This extract was used for the determination of total sugars. Anthrone (150 mg) was dissolved in 72% H2SO4 solution. This reagent was freshly prepared whenever needed. The leaf extract (0.1 mL) was taken in 25 mL test tube then 6 mL of anthrone reagent was poured into each tube carefully and placed in boiling water bath for 10 minutes. The test tubes were then ice-cooled for 10 minutes and incubated for 20 minutes at room temperature (25oC). Optical density was recorded at 625 nm on a spectrophotometer (Hitachi, 220, Japan). The concentration of total sugars was estimated from the standard curve developed with standard glucose (C6H12O6, Sigma) by using the above method (Riazi et al.,1985).
Statistical analysis: The data collected from different physiological and biochemical traits were statistically analyzed by using MSTAT-C Computer Program (Russel D. Freed, Michigan State University, 1989) to calculate the two-way analysis of variance (Steel et al., 1997). The differences among significant means were assessed by Least Significant Difference (LSD) test at 5% and 1% probability level.
RESULTS
Salinity induced physiological traits
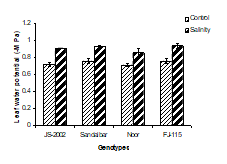
1. Leaf water potential: Salinity significantly inhibited leaf water uptake potential in four sorghum genotypes particularly in Noor and FJ-115 with 0.85 and 0.9 Ψw -MPa, respectively. More negative value of leaf water potential indicated adverse effect of salinity as compared to control (Fig.1A). However, the differences within the sorghum genotypes with respect to NaCl stress were non-significant for leaf water potential (Table 1). Similarly, the interactive effect between salinity and genotypes was non-significant and it showed that leaf water potential was decreased (more negative value) by salinity among all genotypes (Table 1).
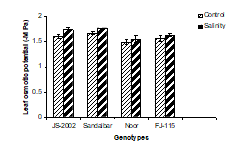
2. Leaf osmotic potential: A significant reduction (more negative value) in leaf osmotic potential (Ψs) was recorded in all genotypes under salinity (Fig. 1B). Even JS-2002 and sandalbar salt tolerant genotypes showed more negative value 1.7 Ψs -MPA as compared to control indicating that salinity adversely affected the leaf osmotic potential trait in all genotypes. However, variations between the genotypes were non-significant. Data showed that the interaction between the salt stress and genotypes were also nonsignificant (Table 1). The maximum reduction (more negative value) was obtained in Sandalbar (9.3%) closely followed by JS-2002 (8.8%) while minimum reduction occurred in Noor (3.9%).
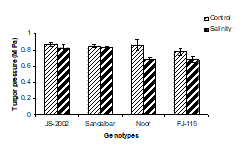
3. Leaf turgor potential: Turgidity is an important phenomenon in the life cycle of all plants for growth and development. Data pertaining to leaf turgor potential (Ψp) indicated that it was significantly decreased with the application of salt stress in sorghum genotypes. Salt sensitive genotypes Noor and FJ-115 showed less turgor potential (0.7 and 0.65 MPA) as compared to control. However, salt tolerant genotypes JS-2002 and Sandalbar indicated better turgor potential (0.8MPa) as compared to control (Fig. 1C). The analysis of variance showed that interaction between salinity and genotypes was non-significant (Table 1). However, the maximum inhibition in leaf turgor potential occurred in Noor (20.9%) followed by FJ-115 (12.8%) and minimum reduction was determined in Sandalbar (2.3%).
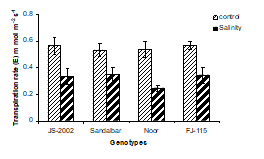
4. Transpiration rate: Rate of transpiration (E) was strongly inhibited by salinity in all genotypes (Fig. 1D). Noor and FJ-115 genotypes showed maximum reduction in transpiration rate (E) with 0.25 and 0.3 mmol H2O m-2S-1 values, respectively. However, JS-2002 with (0.56 mmol H2O m-2S-1) transpiration rate followed by Sandalbar (0.533 mmol H2O m-2S-1) showed great salt tolerant potential for this trait by maintaining the higher rate of transpiration than Noor cultivar (Fig. 1D)
5. Net rate of photosynthesis: Data regarding net rate of photosynthesis (Pn) indicated that it decreases significantly with salinity stress (Table 1). The comparison between different sorghum genotypes showed that they responded differentially to salt stress. Under salinity, the maximum Pn value was observed in Sandalbar (5 μmol m-2S-1), while Noor genotype showed minimum photosynethetic potential (2 μmol m-2S-1) (Fig 1E). The statistical analysis (ANOVA) indicated that interaction between salinity and genotypes was also significant (Table 1). Under salinity, the best performance was shown by FJ-115 followed by Sandalbar, JS-2002 and Noor. However, maximum reduction was shown by Noor while less reduction was observed in Sandalbar (Fig 1E). So Sandalbar and FJ-115 genotypes found best in performance under salinity as for as photosynthetic activity concerned.
6. Stomatal conductance: Stomatal conductance (gs) was negatively controlled by salinity in all four genotypes of sorghum. The maximum inhibition in gs was recorded in Noor (1.7 mmol m-2S-1) followed by FJ-115 (2.3 mmol m-2S-1) genotypes of sorghum as compared to control (Fig. 1F).
Under no sality stress, the highest gs (5.54 mmol m-2S-1) was observed in Sandalbar followed by JS-2002 (5.32 mmol m-2S-1). The interaction between salt stress and the genotypes showed significant results (Table 1). The best performance was given by JS-2002 by maintaining the minimum reduction (4.7%) in gs under salinity stress. The highest reduction was found in Noor (62.8%) followed by FJ-115 (40.3%) genotypes of sorghum, while Sandalbar genotype was average in performance with gs (18.9%).
7. Substomatal conductance: Substomatal conductance or inter cellular CO2 concentration (Ci) increased significantly with application of salt stress in all genotypes (Fig. 2, Table 2). Under salinity stress, the highest substomatal conductance was estimated in JS-2002 (260.11 μmol mol-1) and the second highest Ci was recorded in Sandalbar (172.9 μmol mol-1) followed by FJ-115 (141.38 μmol mol-1) and Noor (139.19 μmol mol-1) as compared to control (Fig. 2). Variations among the genotypes were significant and they behaved differently to salinity treatments. Under sality stress, the maximum increase in substomatal conductance was obtained in Sandalbar (46%) followed by JS-2002 (24%) and minimum increase (13%) was found in Noor (Table 2). These results indicated that JS-2002 and Sandalbar genotypes showed best performance in salinity than other genotypes for substomatal conductance trait.
(A) (B)
(C) (D)
(E) (F)
 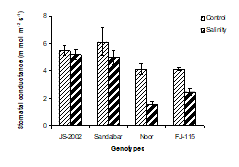
Figure 1. Physiological traits (A) Leaf water potential; (B) Leaf osmotic potential; (C) Leaf turgor potential; (D) Transpiration rate; (E) Net rate of photosynthesis; (F) Stomatal conductance of four sorghum genotypes when subjected to 0 (control) and 100mM NaCl (salinity stress) with Hoagland nutrients solution in sand culture.
Table 1. Mean squares from analyses of variance (ANOVA) of data for leaf water, osmotic, turgor potential, transpiration rate, net rate of photosynthesis and stomatal conductance of four sorghum genotypes subjected to NaCl stress (0 and 100 mM).
|
S.V.
|
Degree of freedom
|
Leaf water potential
(-MPa)
|
Leaf osmotic potential
(-MPa)
|
Leaf turgor potential
(MPa)
|
Transpiration rate
(m mol H2O m-2 S-1)
|
Net rate of photosynthesis
(μ mol CO2
m-2 S-1)
|
Stomatal conductance
(m mol H2O m-2 S-1)
|
|
Genotypes (G)
|
3
|
0.177**
|
0.042*
|
0.046**
|
0.519**
|
39.219**
|
10.494**
|
|
NaCl treatments (S)
|
1
|
0.006 NS
|
0.021 NS
|
0.018*
|
0.051*
|
13.363**
|
7.028**
|
|
G x S
|
3
|
0.001 NS
|
0.011 NS
|
0.007NS
|
0.016 NS
|
3.572*
|
3.024**
|
|
Error
|
16
|
0.002
|
0.007
|
0.004
|
0.013
|
1.063
|
0.700
|
|
Total
|
23
|
*, ** = Significant at p ≤ 0.05 and 0.01, respectively, NS = Non-significant
Table 2. Mean squares from analyses of variance of data (ANOVA) for sub stomatal conductance, Chl. a, Chl.b, total chlophyll, carotenoids and soluble sugars of four sorghum genotypes subjected to NaCl stress (0 and 100 mM).
|
S.V.
|
Degree of freedom
|
Sub stomatal conductance
(Ci) (μmol mol -1)
|
Chl. a
(mg g-1
F. W.)
|
Chl. b
(mg g-1
F. W.)
|
Total Chl. Contents
(mg g-1
F. W.)
|
Total carotenoids
(mg g-1
F. W.)
|
Total soluble sugars
(mg g-1 F.W.)
|
|
Genotypes (G)
|
3
|
4916.629**
|
0.248 **
|
0.311**
|
1.115 **
|
3.074**
|
0.085**
|
|
NaCl treatments (S)
|
1
|
20676.306**
|
0.007 NS
|
0.002 NS
|
0.011 NS
|
0.391**
|
0.027**
|
|
G x S
|
3
|
544.382 NS
|
0.024 NS
|
0.008 NS
|
0.049**
|
0.460**
|
0.013**
|
|
Error
|
16
|
216.448
|
0.008
|
0.006
|
0.012
|
0.003
|
0.000
|
|
Total
|
23
|
*, **, *** = Significant at p ≤ 0.05, 0.01, and 0.001, respectively. NS= Non-significant
Salinity induced biochemical traits
1. Chlorophyll ‘a’ and ‘b’: Salinity stress caused a marked reduction both in chlorophyll ‘a’ and ‘b’ contents in all sorghum genotypes (Fig. 3 A & B). Under salinity, the maximum chlorophyll ‘a’ content was determined in JS-2002 and Sandalbar sorghum genotypes (0.56 & 0.57 mg g-1 F.W), respectively. However, the maximum reduction in chlorophyll ‘a’ content was recorded in FJ-115 (45.4%) followed by Noor (35.5%) and minimum reduction was measured in JS-2002 (11.5%) (Fig. 3A). The maximum chlorophyll ‘b’ content was found in JS-2002 and Sandalbar followed by Noor and FJ-115 among all four sorghum genotypes under control conditions (Fig. 3B). However, the highest reduction in chlorophyll ‘b’ contents was determined in Noor (65.3%) followed by FJ-115 (64.1%). While JS-2002 showed only (29.6%) reduction in chlorophyll ‘b’ contents as compared to control (Fig. 3B). The interaction between genotypes and salinity was found non-significant (Table 2).
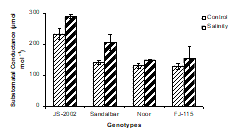
Figure 2. Substomatal conductance of four sorghum genotypes, subjected to 0 and 100mM NaCl stress with Hoagland nutrients solution in sand culture.
2. Total chlorophyll contents: The total chlorophyll content was adversely affected by the application of salt stress in all sorghum genotypes. The interactions between salinity and genotypes in case of total chlorophyll contents were found significant (Table 2). The maximum total chlorophyll content was recorded in Sandalbar (0.8 mg g-1 F.W) followed by JS-2002 (0.7 mg g-1 F.W) sorghum genotypes under salinity conditions. Highest decrease in total chlorophyll content under salinity was found in FJ-115 (52.1%) followed by Noor (46.1%) genotype as compared to control (Fig. 3C).
3. Total carotenoids contents: Application of salinity stress caused a significant increase in carotenoids in all genotypes as compared to non-saline environments (Fig. 3D). Under salinity, the maximum carotenoids value was recorded by FJ-115 (2.9 mg g-1 F.W) followed by Noor (2.9 mg g-1 F.W) and minimum carotenoids contents were noted in JS-2002 and Sandalbar (1.9 mg g-1 F.W) genotypes (Fig. 3D). The maximum increase in value of carotenoids contents were measured in FJ-115 (118.1%) and lowest increase was found in Sandalbar (16.8%) as compared to control under salinity stress among all four sorghum genotypes (Fig. 3D). All genotypes behaved differently for salt stress and variations among them were found significant. The interaction between the salt stress and genotypes was also significant (Table 2).
4. Accumulation of total soluble sugars: Accumulation of total soluble sugars was significantly increased in leaves under salinity stress in all sorghum genotypes and they showed differential behavior towards salt stress. The interactions between salt stress and genotypes were found significant (Table 2). Under salinity, the maximum total soluble sugars were estimated in Sandalbar (0.49 mg g-1 F.W) and minimum was found in FJ-115 (0.26 mg g-1 F.W) (Fig. 4).
DISCUSSION
The salt stress alters plant metabolisim and causes the development of various physiological and biochemical changes (traits) in plants because of the ion toxicity. Soil salinity adversely affects the cell membrane integrity, structure of membrane proteins, chemical properties of cell wall and ions permeability of membranes.
The main purpose of the current study was to identify some physiological and biochemical traits in various sorghum genotypes which cope the salt stressed conditions and then these traits can be used as an indicator for selection of best sorghum cultivars in breeding programmes. These appropriate and quick selection would lead towards enhanced yield and production by these salt tolerant sorghum genotypes in salinity stressed areas. It is well established fact that growth of sensitive genotypes inhibited more severely than the tolerant ones, also confirmed by present data. The differences in behavior to salinity is due to the genetic variations among the genotypes (Hamid et al., 2008; Shrestha et al., 2016). In the current study, this element has been established by the factual data that the growth of salt tolerant genotypes showed better results than sensitive ones under salinity stress condition in stabilizing and maitaining the physiological and biochemical traits.
The tolerant genotypes have lower uptake of sodium ions than sensitive ones (Ashraf et al., 2008). Reduction in plant growth and development may be due to lower transport of essential ions like NO3- that reduced the nitrogen compounds in the plant tissues under high Na+ and Cl- toxicity (Riazi et al., 1985; Yang et al., 2020). Under saline conditions, osmotic stress and ion toxicity are the major barriers for the development of plants (Shrestha et al., 2016).
Present investigations also confirmed that salinity affected plant metabolisim adversely and there was reduction in leaf water and osmotic potential under salinity stress. A single physiological and biochemical process is not responsible for limitation of plant growth but it depends upon multiple factors, such as photosynthesis, leaf water, transpiration, turgor and osmotic potentials (Ashraf and Fatima, 1994) as represented in the current study that all physioilogical parameters were found affected by salinity stress (Table 1; Fig 1,2).
The growth rate inhibition and disturb metabolism in various plants subjected to salinity stress is associated with the slow down of rates of photosynthesis (Yang et al., 2020). Salinity stress can severely affect photosynthetic electron transport in sensitive plant species and inhibit activity of photosystem II because of accumulations of toxic ions ultimately reduces net rate of photosynthesis (Negrão et al., 2017), as indicated in present study observations of photosynthetic traits (Table 1).
(A) (B)
 
(C) (D)
 
Figure 3. (A) Chlorophyll a (B) Chlorophyll b (C) Total chlorophyll (D) Total carotenoids contents of four sorghum genotypes when plants were subjected to 0 (control) and 100 mM NaCl (salinity stress) with Hoagland nutrients solution in sand culture.
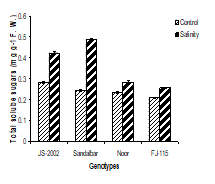
Figure 4. Total soluble sugar contents of four sorghum genotypes when subjected to 0 and 100mM NaCl stress with Hoagland nutrients solution in sand culture.
It is well-documented fact that photosynthetic activity is directly related to leaf water potential and it reduces as water potential of the plant cells reduces, therefore stomatal closure occurred in leaves. In current study, findings about these traits under salt stress provide strong evidence that stress induce changes in regulation of photosynthetic genes expression reflecting the accumulative belongings of low water as well as osmotic potential especially in plants growing under salt stressed conditions (Table 1&2).
This study results clearly described that leaf osmotic, water and turgor potentials were adversely controlled by salinity stress, resulting in closure of stomata and low transpiration rate which decreased the net rate of photosynthesis in all four sorghum genotypes (Fig.1, 2). The negative response of salt stress may be attributed to reduced leaf area expansion which ultimately lowered the net rate of photosynthesis (Ashraf and Fatima, 1994; Ashraf et al., 2013; Negrão et al., 2017; Yang et al., 2020). The plant growth and development are a complex syndrome under salt stress leading to many physiological and biochemical alterations such as ion toxity, osmotic stress and nutrients deficiencies (He et al., 2009).
Photosynthetic efficiency of plants also directly correlated to the chlorophyll contents which are adversely affected by salinity stress. In the present study too, chlorophyll contents have reduced due to salinity stress (Fig. 3A, B, C). However, the highest reduction in cholorophyll ‘a’ and ‘b’ was found in salt sensitive sorghum genotypes (FJ-115 and Noor) while salt tolerant (JS-2002 and Sandalbar) showed strong maintainance in chlorophyll contents under salinity stress. The decrease of chlorophyll content was dependent on the salinity level, the time of exposure to salts and the species. In contrast, chlorophyll contents in salt-tolerant plants either dose not decline or else rises with increasing salinity. Chlorophyll concentration can be used as a sensitive indicator of the cellular metabolic state; hence, its decrease signifies toxicity in tissues due to accumulation of ions. In contrast, the maximum total carotenoids were recorded in sensitive genotypes and its lowest amount was noted in the tolerant (JS-2002 and Sandalbar) genotypes (Fig. 3D). Salinity is responsible for reduction in chlorophyll a, b and total chlorophyll contents but increased carotenoid contents in leaves resulting reduction in photosynthetic activity (Zang et al., 2009). It was reported earlier that salinity could alter the photosynthetic metabolism, efficiency and leaf chlorophyll contents in various cultivars (Gull and Kausar, 2018), prooved by current study data (Table 2).
The capability of plants to tolerate salt stress depends on cascade of biochemical metabolism that enhances water uptake, protection of chloroplast metabolism to maintain ion homeostasis (Loukehaich et al., 2011). Plants adopted several mechanisms for balancing osmotic pressure changes in the root medium. Crops under saline conditions decrease the cellular osmotic potential by increasing the concentrations of free amino acids, inorganic solutes and insoluble particles, accumulation of which helps in osmotic adjustment (Khan et al., 1995).
The soluble sugars of all sorghum genotypes were increased by the application of salinity stress. The maximum increase was recorded in salinity tolerant JS-2002 and Sandalbar genotypes, while minimum amount was calculated in FJ-115, the sensitive genotypes followed by Noor, the moderately tolerant sorghum variety (Fig. 4). These investigations are in parallel to many researchers who showed that the amount of soluble sugar contents in shoots were directly associated to osmotic adjustments in salinity stress (Dhanapackiam and Ilyas, 2010; Culha and Çakırlar, 2011; Khalil, 2013). It was studied that salinity stress caused a significant increase in non-reducing, reducing and total soluble sugar contents in salt tolerant wheat genotypes (Hamid et al., 2008), which might be used as biochemical markers for identifying salt tolerance potential. So, increase in sugars contents as a result of salinity in JS-2002 and Sandalbar is the evidence that these are salt tolerant sorghum genotypes. However, many glycophytes do not accumulate these sugar contents in salinity stressed environments (Ashraf and Harris, 2004). It is well studied now that even very low amount of sodium ion in the growth medium was responsible for increase in sucrose, fructose and glucose. It has been reported that salt tolerant lines of sorghum in saline environment accumulate more sugars than under non-saline conditions and this increase in sugars is directly related to salt tolerance potential of plants (Bavei et al., 2011). Similar observations were recorded in this study (Table 2). The higher accumulation of sugar contents in shoots were significantly related to salt stress for osmotic adjustment. So, accumulation of soluble sugars in sorghum genotypes can be used as physiological indicator as salinity tolerance potential (Netondo et al., 2004). Environmental salinity stress resistance in crops is recognizable through measurements of major physiological and biochemical traits, like water uptake, net rate of photosynthesis, total chlorophyll and sugar contents which can be used to monitor overall plant responses in saline environments (Igartua, 1995; Rania et al., 2007; Rui-dong, 2018). The documented literature showed that more accumulation of toxic ions in saline soils adversely control the various enzymes synthesis and their activities. Consequently, it affects the overall plant growth and metabolic potential under salt stress (Khalil, 2013; Roberta et al., 2020; Shakeri et al., 2020; Dehnavi et al., 2020). Based on the results of this study,it is clear that these physiological and biochemical traits showed significant variations among all four sorghum genotypes under salinity stress, needed to be used and explored more to estimate the extent of genetic diversity at inter and intra specific level in a wide range of crop species.
Conclusion: Salt tolerant sorghum genotypes Sandalbar and JS-2002 maintained high leaf water potential, net photosyenthetic rate, stomatal conductance rate, chlorophyll contents and total soluble sugars, thus, these traits may be used as physiological and biochemical indicators to identify salt tolerant sorghum genotypes and could help in development of high yielding salt tolerant sorghum cultivars. Plant tolerance is linked to metabolic and genetic variations and these are the basic tools for crop improvement. Current study indicated that sorghum cultivars have shown great potential of metabolic, physiological and genetic variability under salt stress conditions and these traits could be realistically used to evaluate the genetic diversity and differentiation among sorghum genotypes. These observations could facilitates the use of metabolic varitions as promising indicator parameteres in sorghum breeding programmes.
Significance statement: The observations of this study indicated that exploration of metabolic and genetic variations among different sorgum cultivars is the need of the day considering the alarming increase in agricultural salinity level and importance of sorghum as broadly used feed crop. Sorghum is the 5th most widely grown crop world-wide and has been part of the farming landscape for decades throughout the world cropping system due to its plasticity and wide range of forms (phenotypes and genotypes). Its capacity to provide numerous ecosystem services makes it a crop of the future. Sorghum cultivars analyzed in current study have not been explored and reported earlier in details for its water, photosynthetic and metabolic traits development under salinity stress. Sorgum cultivars Sandalbar and JS-2002 showed great salinity tolerancec potential due to its genetic vitality, so these cultivars could be a great benefit for breeding programmes to select the salt tolerant individuals for better production and yield.
Acknowledgments: We are grateful to the Department of Botany, GC (W) University, Faisalabad, Pakistan and Nuclear Institute for Agriculture and Biology (NIAB), Faisalabad, Pakistan for supporting and providing the research facilities in this study and the seed manager of Ayub Agriculture Research Institute (AARI), Government of Punjab, Pakistan and Seed Certification Department of Pakistan for providing seeds of sorghum cultivars.
Financial disclosure: Financial support of this research work/publication was partly provided by Biochemistry Department, King Abdulaziz University, Jeddah, Saudi Arabia and contributed by researchers of current study themselves also.
Conflict of interest: Authors would hereby like to declare that there is no conflict of interests that could possibly arise.
REFERENCES
- Arnon, D.I (1949). Copper enzymes in isolated chloroplasts. Polyphenoloxidase in Beta vulgaris. Plant physiol. 24: 1.
- Ashraf, M., and H. Fatima (1994). Intra‐specific variation for salt tolerance in linseed (Linum usitatissimum L.). J. Agron. Crop Sci. 173: 193-203.
- Ashraf, M., and P. Harris (2004). Potential biochemical indicators of salinity tolerance in plants. Plant Sci. 166: 3-16.
- Ashraf, M., N. Rafique, M. Ashraf, N. Azhar, and M. Marchand (2013). Effect of supplemental potassium (K+) on growth, physiological and biochemical attributes of wheat grown under saline conditions. J. Plant Nutr. 36: 443-458.
- Ashraf, M.Y., F. Hussain, J. Akhter, A. Gul, M. Ross, and G. Ebert (2008). Effect of different sources and rates of nitrogen and supra optimal level of potassium fertilization on growth, yield and nutrient uptake by sugarcane grown under saline conditions. Pak. J. Bot. 40: 1521-1531.
- Bavei, V., B. Shiran, M. Khodambashi, and A. Ranjbar (2011). Protein electrophoretic profiles and physiochemical indicators of salinity tolerance in sorghum (Sorghum bicolor L.). Afr. J. Biotechnol. 10: 2683-2697.
- Calviño, M. and J. Messing (2012). Sweet sorghum as a model system for bioenergy crops. Curr. Opin. Biotech. 23: 323-329.
- Culha, S., and H. Çakırlar (2011). Effect of salt stress induced by NaCl on safflower (Carthamus tinctorius L.) cultivars at early seedling stages. Hacettepe J. Biol. Chem. 39: 61-64.
- Davies, B. (1976). Carotenoids, In: Chemistry and biochemistry of plant pigents (Ed.Goodwin, T.W.) 2. London: Academic Press:39-165.
- Dehnavi, A. R., M. Zahedi., A. Ludwiczak., S. C. Perez., and A. Piernik (2020). Effect of salinity on seed germination and seedling development of sorghum (Sorghum bicolor (L.) Moench) genotypes. Agronomy. 10 (859):1-15.
- Dhanapackiam, S. and M. Ilyas (2010). Effect of salinity on chlorophyll and carbohydrate contents of Sesbania grandiflora seedlings. Ind. J. Sci. Technol. 3: 64-66.
- Flower, D., A.U. Rani, and J. Peacock (1990). Influence of osmotic adjustment on the growth, stomatal conductance and light interception of contrasting sorghum lines in a harsh environment. Funct. Plant Biol. 17: 91-105.
- Flowers, T., and A. Yeo (1995). Breeding for salinity resistance in crop plants: where next? Funct. Plant Biol. 22: 875-884.
- Gull, M., and A. Kausar (2018). Comparative analysis of various growth, ions uptake and other physiological performance of two rice (Oryza sativa L.) genotypes under altering saline conditions. Pharmacophore. 9(5): 73-81.
- Hamid, M., M.Y Ashraf., K. Rehman and M. Arshad (2008). Influence of salicylic acid seed priming on growth and some biochemical attributes in wheat grown under saline conditions. Pak. J. Bot. 40: 361-367.
- He, Y., Z. Zhu, J. Yang, X. Ni, and B. Zhu (2009). Grafting increases the salt tolerance of tomato by improvement of photosynthesis and enhancement of antioxidant enzymes activity. Environ. Exp. Bot. 66: 270-278.
- Igartua, E (1995). Choice of selection environment for improving crop yields in saline areas. Theor. Appl. Genetics. 91: 1016-1021.
- Igartua, E., M. Gracia, and J. Lasa (1995). Field responses of grain sorghum to a salinity gradient. Field Crops Res. 42: 15-25.
- Jones, D.A (1998). Why are so many food plants cyanogenic? Phytochemistry. 47: 155-162.
- Kausar, A., M.Y. Ashraf., I. Ali., M. Niaz, and Q. Abbass (2012). Evaluation of sorghum varieties/lines for salt tolerance using physiological indices as screening tool. Pak. J. Bot. 44: 47-52.
- Kausar, A., M.Y.Ashraf., A. Khurshid, and M. Gull (2015). Photosynthesis, transpiration, stomatal conductance potential and water uptake in selected rice cultivars (Oryza sativa) under various saline conditions. SYLWAN J. 159 (3): 258-265.
- Kausar, A., and M. Gull (2019). Influence of salinity stress on the uptake of magnesium, phosphorus, and yield of salt susceptible and tolerant sorghum cultivars (Sorghum bicolor L.). J. Appl. Biol. Biotech. 7(3): 53-58.
- Khalil, R. (2013). Molecular and biochemical markers associated with salt tolerance in some sorghum genotypes. World Appl. Sci. J. 22 (4): 459-469.
- Khan A.H, M.Y. Ashraf, S.S.M. Naqvi, B. Khanzada and M. Ali (1995). Growth, ion and solute contents of sorghum grown under NaCl and Na2SO4 salinity stress. Acta Physiol. Plant. 17: 261-268.
- Kosová, K., I. Prášil, and P. Vítámvás (2013). Protein contribution to plant salinity response and tolerance acquisition. Int. J. Mol. Sci. 14: 6757-6789.
- Loukehaich R., M. Elyachioui, N. Belhabib and A. Douira (2011). Identifying multiple physiological responses associated with salinity-tolerance for evaluating three tomato genotypes selected from Moroccan territory. J. Anim. Plant Sci. 10: 1219-1231.
- Munns, R., and M. Tester (2008). Mechanisms of salinity tolerance. Annu. Rev. Plant Biol. 59: 651-681.
- Negrão. S., S. M. Schmöckel, and M. Tester (2017). Evaluating physiological responses of plants to salinity stress. Ann Bot. 119(1): 1-11.
- Netondo, G.W., J.C. Onyango and E. Beck (2004). Sorghum and salinity: Response of growth, water relations, and ion accumulation to NaCl salinity. Crop Sci. 44: 797-805.
- O'Donnell, N.H., B.L. Moller, A.D. Neale, J.D. Hamill, C.K. Blomstedt, and R.M. Gleadow (2013). Effects of PEG-induced osmotic stress on growth and dhurrin levels of forage sorghum. Plant Physiol. Biochem. 73: 83-92.
- Rania, A.A.Y., M.F. Ahmed, and M.M. EL-Menshawi (2007). Molecular genetic markers associated with salt tolerance in grain sorghum. Arab J. Biotechnol. 2: 249-258.
- Riazi, A., K. Matsuda, and A. Arslan (1985). Water-stress induced changes in concentrations of proline and other solutes in growing regions of young barley leaves. J. Exp. Bot. 36 (11): 1716-1725.
- Roberta, C., R. Sanoubar., C. Lambertini., M. Speranza., L. V. Antisari., G. Vianello, and L. Barbanti (2020). Salt tolerance and Na allocation in Sorghum bicolor under variable soil and water salinity. Plants. 9 (561):1-20.
- Rui-dong, H. (2018). Research progress on plant tolerance to soil salinity and alkalinity in sorghum. J. Integr. Agric. 17 (4):739-746.
- Sanchez, A., P. Subudhi, D. Rosenow, and H. Nguyen (2002). Mapping QTLs associated with drought resistance in sorghum (Sorghum bicolor L. Moench). Plant Mol. Biol. 48: 713-726.
- Shakeri, E., Y. Emam., M. Pessarakli, and S.A. Tabatabaei (2020). Biochemical traits associated with growing sorghum genotypes with saline water in the field. J. Plant Nutr. 43:1136-1153.
- Shrestha, A., R. Cox., Y. Wu., O. Robles., L.L. deSouza., S.D. Wright, and J.A. Dahlberg (2016). Moisture and salt tolerance of a forage and grain sorghum hybrid during germination and establishment, J.Crop Improve. 30 (6): 668-683.
- Steel, R.G.D., J.H.Torrie, and D.A.Dicky (1997). Principles and Procedures of Statistics - A Biometrical Approach. 3rd Edition, McGraw Hill, Inc. Book Co., New York, 352-358.
- Yang, Z., J.L. Li., L.N. Liu., Q. Xie, and N. Sui (2020). Photosynthetic regulation under salt stress and salt-tolerance mechanism of sweet sorghum. Front. Plant Sci. 10:1-12
- Zang, A., X. Xu, S. Neill, and W. Cai (2009). Over expression of OsRAN2 in rice and Arabidopsis renders transgenic plants hypersensitive to salinity and osmotic stress. J. Exp. Bot. 61:777-89.
|


