MORPHOMETRIC CHARACTERIZATION OF LOCAL AND EXOTIC CHICKEN GENOTYPES IN THREE AGRO-ECOLOGIES OF NORTHERN ETHIOPIA
S. Markos 1, B. Belay 2, T. Dessie 3 and T. Astatkie 4, *
1 Humera Agricultural Research Center of Tigray Agricultural Research Institute, Mekelle, Tigray, Ethiopia
2 Injibara University, Injibara, Ethiopia
3 International Livestock Research Institute (ILRI), Addis Ababa, Ethiopia
4 Faculty of Agriculture, Dalhousie University, Truro, Nova Scotia, Canada
*Corresponding author’s email: astatkie@dal.ca
ABSTRACT
The northern part of Ethiopia is endowed with local and exotic breeds of chicken; however, their morphometric characterization needs to be done to support future improvements and conservation. Hence, the study was conducted in three agro-ecologies (lowland, midland, and highland) of Northern Ethiopia to assess the morphometric traits of local and exotic (Naked-neck) chicken genotypes. The experiment was designed as 4x2 factorial with Chicken genotype (4 levels: local from each of lowland, midland and highland, and exotic from lowland) and Sex (2 levels: female and male) being the factors. ANOVA was conducted to determine the main and interaction effects of these factors on 21 morphometric traits. The results revealed significant interaction of Chicken genotype and Sex on all morphometric traits other than skull length, skull width, skull index and neck length highlighting the presence of vast sex specific differences among the genotypes. Apart from comb, earlobe and beak indices and wattle width, male Naked-neck (from lowland) have significantly higher values than the other seven combinations. The morphometric variations of chicken genotypes unveiled in this study are good indicators of genetic diversity of chicken population in Northern Ethiopia and calls for designing community based genetic improvement program to maximize desirable traits.
Keywords: Highland, Lowland, Midland, Quantitative trait
https://doi.org/10.36899/JAPS.2021.4.0287
Published online December 15, 2020
INTRODUCTION
Poultry contributes about 35% of the global livestock meat, of which chicken species account for 88% (FAO, 2012a). Village poultry contributes to poverty alleviation and household food security in many developing countries (Alders and Pym, 2009). Eighty percent of the over 1.5 billion chickens raised in Africa are local, and they are found in the rural and peri-urban areas, where they are raised in small numbers by traditional low-input–low-output systems (Gueye, 1998). Indigenous chickens have significant contribution to food security and economic sustainability of rural households (Gueye, 2002; Aboe et al., 2006).
Village chickens make significant contributions to the nutrition, economy and socio-cultural roles of households in the world, especially to those below poverty line. The impact of village chicken in the national economy of developing countries and its role in improving the nutritional status, income, food security and livelihood of many smallholders is significant, due to its low cost of production (Abdelqader et al., 2007). Furthermore, village chickens serve as “transport (transitional) bridge” from small livestock to large livestock species production or the first step of the ladder to get out of poverty (Aklilu et al., 2007), and act as a form of households’ savings and insurance (Besbes, 2009). Recurrent natural selections under scavenging conditions have made indigenous chickens robust and tolerant to various diseases and parasites. Farmers prefer to rear local chickens than exotic breeds as local chickens have a better survival rate than exotic ones under extensive scavenging conditions with very low levels of inputs (Minga et al., 2004). Despite their desirable characteristics and merits, indigenous chicken breeds are under threat due to various factors such as changing production systems and indiscriminate crossbreeding (Besbes, 2009).
Recent poultry population of Ethiopia is estimated to be 59.5 million with indigenous chicken of non-descriptive breeds accounting for 90.85%, hybrid chicken for 4.76% and exotic breeds for 4.39% (CSA, 2016). These figures demonstrate the significance of the contribution of local chickens towards livelihood improvement of Ethiopian households. The total number of chicken eggs in Ethiopia is estimated to be 127.6 million, and 92.7 million of these eggs are obtained from local chickens (CSA, 2016). But, the productivity of local chickens is disproportionately low, which masks their potential contribution to uplift the livelihood of chicken producers.
Efforts to improve the performance of indigenous chickens were initiated by the Government of Ethiopia in the early 1990s through the introduction of exotic breeds (Pagani and Wossene, 2008). However, this indiscriminate introduction of exotic genetic resources before proper characterization, utilization and conservation of indigenous genetic resources is the main cause of the loss of indigenous chicken genetic resources (Besbes, 2009).
This calls for morphometric characterization of indigenous chickens to pave the way for designing breeding programs that focus on improving productivity. Morphometric characterization is the initial step for long-term genetic improvement as it provides the basis for any other livestock development interventions and pre-requisite information for designing appropriate breeding and utilization programs (Olawunmi et al., 2008). Although genetic characterization is the most accurate method of evaluating genetic diversity, phenotypic characterization based on large sample size provides a reasonable representation of overall genetic performance.
Several studies (Dana et al., 2010; Chebo and Nigussie, 2016; Terfa et al., 2019) have been conducted on breeding practices and trait preferences of village chickens for designing breeding schemes for Ethiopian local chickens. Also, village poultry consumption and marketing system had been carried out in Ethiopia (Aklilu et al., 2007). Although morphological and morphometric characterization of local chicken populations had been conducted in the Southern part of Ethiopia (Tareke et al., 2018), a similar study was not conducted on chicken in the northern part of Ethiopia. Egg quality traits had also been evaluated in local Chicken ecotypes (Markos et al., 2017) in the western zone of Tigray, Ethiopia. However, no research has been conducted on phenotypic characterization of the existing local chicken ecotypes based on morphometric traits in Northern Ethiopia. With lack of such study, an appropriate design of breeding programs is impossible for local chicken agro-ecologies. Thus, this study was designed to characterize the local chicken agro-ecologies of western zone of Tigray, Ethiopia based on morphometric traits and to compare these traits with that of exotic (Naked-neck) chicken.
MATERIALS AND METHODS
The study was conducted in three agro-ecologies (lowland, midland and highland represented by three rural districts, namely Kafta Humera, Welkait, and Tsegede, respectively) of western zone of Tigray Regional State of Ethiopia. The altitude ranges for lowland, midland and highland chicken agro-ecologies are <1500, 1500-2500, and >2500 meters above sea level, respectively. The geographical location of the zone is 13°42′ to 14°28′ north latitude and 36°23′ to 37°31′ east longitude. The annual rainfall of the zone ranges from 600 to 1800 mm, while the annual temperature ranges from 270C to 45 0C in lowland and 100C to 22 0C in midland and highland. The study zone has an area of 1.5 million hectares.
Stratified random sampling was used by stratifying the zone into groups of kebeles (smallest administrative unit in Ethiopia) that represent lowland, midland, and highland, and randomly selecting farmers and chickens from each stratum. The selected farmers represented different village poultry population density, chicken production potential, road accessibility and chicken ecotype. The experimental design was 4x2 factorial with 30 replications. The first factor with 4 levels is Chicken genotype and the second factor with 2 levels is Sex. The experimental units were chickens, and the data on morphometric traits were obtained from 240 chickens (30-male and 30-female chicken randomly selected from each of lowland (local and Naked-neck), midland (local), and highland (local) agro-ecologies). The chicken used were approximately six-month old or older as per the information provided by the owners, and further verified by the researchers using wing plumage. Naked-neck chickens were included in this study because they are very prominent indigenous breeds of poultry in many countries including Pakistan (Shafiq et al., 2018) due to their resilience to harsh environments.
Twenty-one morphometric traits (body length and weight; shank length; comb length, width and index; earlobe length, width and index; wattle length, width and index; skull length, width and index; neck length; beak length, width and index; spur length; and wingspan) were measured based on the methodology detailed in FAO (2012b) and Francesch et al. (2011) (Fig. 1).
Wingspan and neck, body, and shank length were measured using a measuring tape (±1 mm). A Sensitive balance with an electronic weighing scale (precision = 1 g) was used to measure the live body weight of chickens. Comb length, comb width, earlobe length, earlobe width, wattle length, wattle width, skull length, skull width, beak length, beak width and spur length of the chickens were measured using a calliper (±0.01 mm). All measurements were taken by the same individual consistently early in the morning before the chickens were fed. Five corporals indices were calculated from the above evaluated characteristics and determined following the methodology developed by Francesch et al. (2011). They express the relation between the length and width of the structure/respective quantitative trait. These indices are skull index (skull length/skull width), comb index (comb length/comb width), earlobe index (earlobe length/earlobe width), wattle index (wattle length/wattle width), and beak index (beak length/beak width).
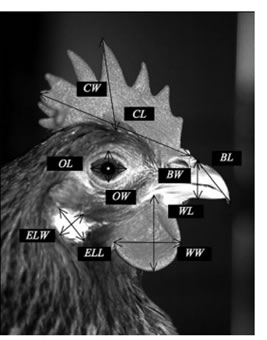
Fig. 1. Measurement of head characteristics (Francesch et al., 2011). Where CL=Comb length, CW=Comb width, WL=Wattle length, WW=Wattle width, ELL=Earlobe length, ELW= Earlobe width, BL=Beak length, and BW=Beak Width.
Statistical Analysis: Two-factor factorial design analysis of variance (ANOVA) was conducted to determine the significance of the main and interaction effects of Chicken genotype (4 levels: Highland, Lowland, Midland, Naked-neck) and Sex (2 levels: Female and Male) on 21 morphometric traits of chicken. The ANOVA model used was:
The effects are: a is the main effect of Chicken genotype, b is the main effect of Sex, and ab is the interaction effect of Chicken genotype and Sex. All effects are considered as fixed. The error term (e) is assumed to be independent, have constant variance and is distributed normally. Since these 21 response variables were measured on n = 30 randomly selected chicken from each of the eight combinations of sex and chicken genotype, the validity of independence assumption is assured. Normal distribution and constant variance assumptions were verified by examining the residuals as described in Montgomery (2020). When the interaction effect is significant, multiple means comparison was done on the 8 combinations of sex and chicken genotype using Tukey’s multiple range test at the 5% level of significance. When only the main effect is significant the multiple means comparison was done either between the two sexes or among the four chicken genotypes. The statistical analysis was completed using SAS 9.4 (SAS, 2014).
RESULTS AND DISCUSSION
The ANOVA p-values that show the significance of the main and interaction effects of chicken genotype and sex on the studied quantitative morphometric traits are presented in Table 1. Chicken genotype significantly (p ≤ 0.01) affected all studied quantitative traits except skull length and width, whereas sex significantly affected all traits except beak index (Table 1). Chicken genotype by Sex interaction effect was significant (p ≤ 0.01) on all morphometric traits except shank and skull length, skull width, skull and beak index (Table 1).
The means of the combinations of chicken genotype and sex shown in Table 2 indicate that, apart from comb, earlobe and beak indices and wattle width, male Naked-neck (from lowland) have significantly higher values than the other seven combinations. Male lowland chicken has significantly higher wattle width than the other seven combinations; and there was no significant difference between local and Naked-neck male chickens (both from lowland) in terms of shank length, comb length, comb and earlobe indices, and wingspan. Lowland local female chickens had significantly longer body length, comb length, wattle length, wattle index and wingspan than the local female chickens in the other two chicken genotypes (Table 2). Midland local female and Naked-neck female chicken had the same comb width, but significantly higher than that of the local female chickens in lowland and highland chicken genotypes; whereas, highland female chicken had significantly longer earlobe length and width than the local lowland and midland female chickens (Table 2).
Table 1. P-values that show the significance of the main and interaction effects of Chicken genotype (CG) and Sex on body length, body weight, shank length, comb length, comb width, comb index, earlobe length, earlobe width, earlobe index, wattle length, wattle width, wattle index, skull length, skull width, skull index, neck length, beak length, beak width, beak index, spur length, and wingspan.
|
Effect
|
body length
|
body weight
|
shank length
|
comb length
|
comb width
|
comb index
|
earlobe length
|
|
CG
|
0.001
|
0.001
|
0.001
|
0.001
|
0.001
|
0.001
|
0.001
|
|
Sex
|
0.001
|
0.001
|
0.001
|
0.001
|
0.001
|
0.001
|
0.001
|
|
CG*Sex
|
0.001
|
0.001
|
0.001
|
0.001
|
0.001
|
0.001
|
0.001
|
|
1.342
|
83.67
|
0.699
|
0.447
|
0.228
|
0.237
|
0.184
|
| |
earlobe width
|
earlobe index
|
wattle length
|
wattle width
|
wattle index
|
skull length
|
skull width
|
|
CG
|
0.001
|
0.001
|
0.001
|
0.001
|
0.001
|
0.001
|
0.128
|
|
Sex
|
0.001
|
0.001
|
0.001
|
0.001
|
0.032
|
0.001
|
0.001
|
|
CG*Sex
|
0.001
|
0.001
|
0.001
|
0.001
|
0.001
|
0.081
|
0.073
|
|
0.182
|
0.256
|
0.588
|
0.495
|
0.263
|
0.723
|
0.500
|
| |
skull index
|
neck length
|
beak length
|
beak width
|
beak index
|
spur length
|
wingspan
|
|
CG
|
0.001
|
0.001
|
0.026
|
0.001
|
0.001
|
0.001
|
0.001
|
|
Sex
|
0.009
|
0.001
|
0.001
|
0.001
|
0.778
|
0.001
|
0.001
|
|
CG*Sex
|
0.989
|
0.212
|
0.001
|
0.001
|
0.006
|
0.001
|
0.001
|
|
0.170
|
0.834
|
0.187
|
0.160
|
0.312
|
0.152
|
1.797
|
*Significant effects that require multiple means comparison are shown in bold. = the square root of the Mean Square Error (MSE) estimates the common standard deviation (s).
Multiple means comparison results of the main effects of chicken genotype and sex shown in Table 3 indicate that midland chicken had significantly higher neck length than the other two local and Naked-neck chickens. All three local chickens have the same (not significantly different), but significantly higher skull length than Naked-neck chicken. The mean skull index values of the lowland chickens (local and Naked-neck) were not significantly different, but significantly smaller than those of the midland and highland local chickens. Male chickens had significantly higher skull length and width, and neck length but lower skull index than female chickens (Table 3).
The results on body length of male chickens are comparable to those of Nigerian male chickens (Daikwo et al., 2011), indigenous male chickens of Southern Ethiopia (Tareke et al., 2018), and Sheka zone of south western Ethiopia (Assefa and Melesse, 2018); but higher than those of male chickens of six agro-ecological zones of Oman (Al-Qamashoui et al., 2014), Nigerian male indigenous chickens (Yakubu et al., 2009) and Northwest Algeria (Dahloum et al., 2016); and lower than those of Tanzanian indigenous male Chickens (Guni and Katule, 2013). The mean body weight of male chickens was in agreement with that of local cock in three districts of North Gondar (Getu et al., 2014) and Sheka zone of south western Ethiopia (Assefa and Melesse, 2018) but higher than those reported from Nigerian local male chickens (Yakubu et al., 2009; Daikwo et al., 2011) and six agro-ecological zones of Oman (Al-Qamashoui et al., 2014); and lower than the body weights of chickens reported from Tanzanian indigenous male Chickens (Guni and Katule, 2013) and North west Algeria (Dahloum et al., 2016).
Naked-neck chickens have higher body weight and body length than local cocks, which corresponds to the findings of Melesse and Negesse (2011) for chickens raised in SNNPRS, Ethiopia; Assefa and Melesse (2018) for chickens raised in Sheka zone of South Western Ethiopia; and Ige et al. (2012) for Nigerian chicken.
The shank length of male chickens in the current study was similar to that of indigenous cocks of Southern Ethiopia (Tareke et al., 2018) and in Bench Maji Zone, South Ethiopia (Bekele et al., 2015), but higher than that of local male chickens of Sheka Zone of South Western Ethiopia (Assefa and Melesse, 2018), Nigerian local male chickens (Yakubu et al., 2009; Daikwo et al., 2011), Omani local chicken (Al-Qamashoui et al., 2014), Tanzanian indigenous male chickens (Guni and Katule, 2013) and intensively managed Nigerian indigenous and exotic male chickens (Ajayi et al., 2012).
Table 2. Mean body length (cm), body weight (gm), shank length (cm), comb length (cm), comb width (cm), comb index, earlobe length (cm), earlobe width (cm), earlobe index, wattle length (cm), wattle width (cm), wattle index, beak length (cm), beak width (cm), beak index, spur length (cm), and wingspan (cm) obtained from the eight combinations of Chicken genotype and Sex.
|
Response variable
|
Highland
|
Lowland
|
Midland
|
Naked-neck
|
|
Female
|
Male
|
Female
|
Male
|
Female
|
Male
|
Female
|
Male
|
|
Body length (cm)
|
23.8h
|
33.0d
|
28.2f
|
39.8b
|
25.1g
|
35.9c
|
30.7e
|
44.0a
|
|
Body weight (gm)
|
1214f
|
1449d
|
1315e
|
1709b
|
1263ef
|
1559c
|
1410d
|
1794a
|
|
Shank length (cm)
|
7.28e
|
9.95c
|
9.77c
|
12.81a
|
8.29d
|
10.77b
|
8.35d
|
13.05a
|
|
Comb length (cm)
|
2.81e
|
5.53c
|
3.26d
|
7.54a
|
1.96f
|
6.71b
|
2.99de
|
7.86a
|
|
Comb width (cm)
|
1.21g
|
3.12c
|
1.44f
|
3.85b
|
1.74e
|
2.76d
|
1.66e
|
4.19a
|
|
Comb index
|
2.33a
|
1.78b
|
2.27a
|
1.97b
|
1.13c
|
2.45a
|
1.81b
|
1.89b
|
|
Earlobe length (cm)
|
1.87e
|
3.13c
|
1.63f
|
3.56b
|
1.29g
|
2.54d
|
1.81e
|
3.99a
|
|
Earlobe width (cm)
|
1.26d
|
1.87c
|
0.91e
|
2.22b
|
0.70f
|
1.34d
|
0.88e
|
2.53a
|
|
Earlobe index
|
1.52d
|
1.69cd
|
1.84bc
|
1.61d
|
1.86bc
|
1.94ab
|
2.07a
|
1.59d
|
|
Wattle length (cm)
|
2.00e
|
5.32b
|
2.55d
|
6.53a
|
1.67e
|
4.53c
|
1.93e
|
6.21a
|
|
Wattle width (cm)
|
1.39d
|
3.39b
|
1.37d
|
4.14a
|
1.09d
|
2.81c
|
1.05d
|
3.55b
|
|
Wattle index
|
1.52c
|
1.58bc
|
1.90a
|
1.60bc
|
1.59bc
|
1.64bc
|
1.87a
|
1.76ab
|
|
Beak length (cm)
|
2.09bc
|
1.98c
|
2.04c
|
2.20ab
|
2.03c
|
2.11bc
|
1.71d
|
2.34a
|
|
Beak width (cm)
|
1.02bc
|
1.04bc
|
1.10b
|
1.26a
|
0.93c
|
0.98bc
|
0.96c
|
1.27a
|
|
Beak index
|
2.06ab
|
1.92bc
|
1.86cd
|
1.76cd
|
2.14a
|
2.19a
|
1.70d
|
1.86cd
|
|
Spur length (cm)
|
0.43e
|
1.92c
|
0.52e
|
2.51b
|
0.25f
|
1.46d
|
0.43e
|
2.68a
|
|
Wingspan (cm)
|
32.6d
|
37.0c
|
40.2b
|
48.1a
|
34.2d
|
39.7b
|
36.4c
|
48.6a
|
*Within each row, means sharing the same superscript letter are not significantly different.
Table 3. Mean skull length (cm), skull index, and neck length (cm) obtained from the four chicken genotypes; and mean skull length (cm), skull width (cm), skull index, and neck length (cm) obtained from the two sexes.
|
Response variable
|
Highland
|
Lowland
|
Midland
|
Naked Neck
|
|
Skull length (cm)
|
6.54a
|
6.38a
|
6.55a
|
5.80b
|
|
Skull index
|
1.78a
|
1.64b
|
1.75a
|
1.59b
|
|
Neck length (cm)
|
12.97d
|
14.81c
|
16.24a
|
15.61b
|
|
Response variable
|
Female
|
Male
|
|
|
|
Skull length (cm)
|
5.83b
|
6.78a
|
|
|
|
Skull width (cm)
|
3.39b
|
4.07a
|
|
|
|
Skull index
|
1.72a
|
1.66b
|
|
|
|
Neck length (cm)
|
14.23b
|
15.59a
|
|
|
*Within each row, means sharing the same superscript letter are not significantly different.
Naked-neck cocks have longer shank than normal local cocks, which is consistent with the reports of Assefa and Melesse (2018). This confirms the findings of Melesse and Negesse (2011) and Assefa and Melesse (2018) who reported that Naked-neck chickens possess better bone length as shank length is considered a good indicator of skeletal development, which is related to the amount of meat a chicken can carry (Melesse and Negesse, 2011). The average wingspan of local cocks in our study was similar to those reported from Northwest Algeria (Dahloum et al., 2016) and three districts of Northern Ethiopia (Getu et al., 2014) but were lower than those reported from local cocks of Southern Ethiopia (Tareke et al., 2018), Sheka Zone of South Western Ethiopia (Assefa and Melesse, 2018), Tanzanian Indigenous male Chickens (Guni and Katule, 2013), Penedesenca and Empordanesa chicken breeds of Spain (Francesch et al., 2011), indigenous male chickens of Bench Maji Zone, South Ethiopia (Bekele et al., 2015), and intensively managed Nigerian indigenous and exotic cocks (Ajayi et al., 2012). The spur length of local cocks in this study was greater than that of the local male chickens of Northern Ethiopia (Getu et al., 2014).
The comb, skull and beak length; and comb, skull and beak width of the studied local cocks were similar to those reported for Penedesenca and Empordanesa chicken breeds of Spain (Francesch et al., 2011). Similar beak lengths but lower neck and comb lengths were reported for Nigerian indigenous male chickens (Yakubu et al., 2009). Although both comb and beak lengths of local cocks in this study were comparable to those of local cocks in the Southern part of Ethiopia (Tareke et al., 2018), local cocks in the present study have longer wattle length, but shorter beak length than the local cocks in Northwest Algeria (Dahloum et al., 2016).
The studied local hens had longer neck than the local hens of Nigeria (Yakubu et al., 2009) and lower than the local hens of Sheka zone of South Western Ethiopia (Assefa and Melesse, 2018). The variability of measurements of the studied chicken from their counter parts in other localities might be attributed to a wider variation in the genetic resources of the chicken as well as differential response to different environmental conditions. Naked-neck chickens possess longer wattles and combs than other local chickens that might indicate better tolerant to hot agro-climatic conditions of lowland agro-ecology, which concords with the findings of Assefa and Melesse (2018) and Ige et al. (2011) who reported that large combs and wattles are import morphological features that allow better heat dissipation in hot tropical environments.
The significant sex differences in body weight and body measurements observed in this study agree with reports from Northwest Algeria (Dahloum et al., 2016), Nigeria (Olawunmi et al., 2008), and Lake Victoria basin of Uganda (Semakula et al., 2011). These differences could be due to the Sexual dimorphism (Semakula et al., 2011) that are attributable to differential effects of growth hormones (androgen and estrogen) (Yakubu et al., 2009) in addition to other factors.
The significant variations in the morphometric traits among the three local chicken genotypes is a major indicator of the presence of high genetic variability among the local chickens of the zone, which can serve as a big potential for local chicken genetic improvements through appropriate genetic improvement methods. The phenotypic discrepancies in morphometric traits may be due to the variations in the agro-ecological variables/elements (altitude, rainfall, temperature, humidity, production system variables and others), which make different production environments in different agro-ecological zones. This will create an opportunity to evolve new breeds/strains from either different or related populations of the same animal species through time with different levels of performances through natural selection in order to cope with environmental changes, new diseases, pest epidemics and others.
Conclusions: The results of the study revealed that the local chicken genotypes raised in the three agro-ecological zones exhibit wide phenotypic variations of morphometric traits. These variations suggest the presence of genetic diversity and an opportunity for genetic improvement of indigenous chickens through appropriate breeding methods. Further in-depth studies are needed to validate the detected variations in morphometric traits at molecular levels and develop local chicken breeds and register them nationally and internationally. Environment friendly and community based holistic genetic improvement programs should also be designed and implemented in order to assure the sustainable improvement, utilization and in-situ conservation of the indigenous chicken.
Acknowledgments: The authors acknowledge financial support from Humera Agricultural Research Center (HuARC) of Tigray Agricultural Research Institute (TARI). We are also grateful to the administrators of the sampled kebeles, the farmers, and the development agents who were involved directly or indirectly during the execution of the project.
REFERENCES
- Abdelqader, A., C.B.A. Wollny, and M. Gauly (2007). Characterization of local chicken production systems and their potential under different levels of management practice in Jordan. Anim. Health Prod.39(3): 155-164. https://doi.org/10.1007/s11250-007-9000-x
- Aboe, P.A.T., K. Boa-Amponsem, S.A. Okantah, P.T. Dorward, and M.J. Bryant (2006). Free-range village chickens on the Accra Plains, Ghana: Their contribution to households. Anim. Health Prod.38(3): 223-234. https://doi.org/10.1007/s11250-006-4357-9
- Ajayi, O.O., M.A. Adeleke, M.T. Sanni, A. Yakubu, S.O. Peters, I.G. Imumorin, M.O. Ozoje, C.O.N. Ikeobi, and O.A. Adebambo (2012). Application of principal component and discriminant analyses to morpho-structural indices of indigenous and exotic chickens raised under intensive management system. Anim. Health Prod. 44(6): 1247-1254. https://doi.org/10.1007/s11250-011-0065-1
- Aklilu, H.A., C.J.M. Almekinders, H.M.J. Udo, and A.J. Van der Zijpp (2007). Village poultry consumption and marketing in relation to gender, religious festivals and market access. Anim. Health Prod.39(3): 165-177. https://doi.org/10.1007/s11250-007-9002-8
- Alders, R.G., and R.A.E. Pym (2009). Village poultry: still important to millions, eight thousand years after domestication. Worlds Poult. Sci. J. 65(2): 181-190. https://doi.org/10.1017/S0043933909000117
- Al-Qamashoui, B., O. Mahgoub, I. Kadim, and E. Schlecht (2014). Towards conservation of Omani local chicken: phenotypic characteristics, management practices and performance traits. Asian-Australas. J. Anim. Sci. 27(6): 767-777. https://doi.org/10.5713/ajas.2013.13541
- Assefa, H., and A. Melesse (2018). Morphological and Morphometric Characterization of Indigenous Chicken Populations in Sheka Zone, South Western Ethiopia. Poult. Fish Wildl. Sci. 6(2): 1-9. https://doi.org/10.4172/2375-1000200
- Bekele, G., K. Kebede, and N. Ameha (2015). On-farm Phenotypic Characterization of Indigenous Chicken and their production system in Bench Maji Zone, South Ethiopia. Sci. Technol. Arts Res. J. 4(1): 68-73. https://doi.org/10.4314/star.v4i1.10
- Besbes, B. (2009). Genotype evaluation and breeding of poultry for performance under sub-optimal village conditions. Worlds Poult. Sci. J. 65(2): 260-271. https://doi.org/10.1017/S0043933909000221
- Chebo, C., and H. Nigussie (2016). Performances, breeding practices and trait preferences of local chicken ecotypes in Southern zone of Tigray, Northern Ethiopia. Asian J. Poult. Sci. 10: 158-164. https://doi.org/3923/ajpsaj.2016.158.164
- CSA (2016). Agricultural Sample Survey 2016/17.Statistical Bulletin 2: 585 Report on Livestock and Livestock Characteristics, Central Statistical Agency (CSA), Addis Ababa, Ethiopia.
- Dahloum, L., N. Moula, M. Halbouche, and S. Mignon-Grasteau (2016). Phenotypic characterization of the indigenous chickens (Gallus gallus) in the northwest of Algeria. Arch. Anim. Breed. 59: 79-90. https://doi.org/10.5194/aab-59-79-2016
- Daikwo, I.S., A.A. Okpe, and J.O. Ocheja (2011). Phenotypic characterization of local chickens in Dekina. J. Poult. Sci.10(6): 444-447. https://doi.org/10.3923/ijps.2011.444.447
- Dana, N., L.H. Van der Waaij, T. Dessie, and J.A. van Arendonk (2010). Production objectives and trait preferences of village poultry producers of Ethiopia: implications for designing breeding schemes utilizing indigenous chicken genetic resources. Anim. Health Prod.42(7): 1519-1529. https://doi.org/10.1007/s11250-010-9602-6
- FAO (2012a). http://www.thepoultrysite.com/articles/2515/global-poultry-trends-2012-poultry-increases-its-share-of-global-meat-production; accessed 20 March 2020.
- FAO (2012b). Phenotypic Characterization of Animal Genetic Resources. FAO Animal Production and Health Guidelines No. 11. Rome, Italy.
- Francesch, A., I. Villalba, and M. Cartañà (2011). Methodology for Morphological Characterization of Chicken and Its Application to Compare Penedesenca and Empordanesa Breeds. Anim. Genet. Resour. 48: 79–84. https://doi.org/10.1017/S2078633610000950
- Getu, A., K. Alemayehu, and Z. Wuletaw (2014). Phenotypic characterization of indigenous chicken ecotypes in the north Gondar zone, Ethiopia. Anim. Genet. Resour. 54: 43-51. https://doi.org/10.1017/S2078633614000113
- Gueye, E.F. (1998). Village Egg and Fowl Meat Production in Africa.Worlds Poult. Sci. J. 54: 73–86. https://doi.org/10.1079/WPS19980007
- Gueye, E.F. (2002). Employment and Income Generation through Family Poultry in Low-Income Food-Deficit Countries.Worlds Poult. Sci. J. 58: 541–557. https://doi.org/10.1079/WPS20020039
- Guni, F.S., and A.M. Katule (2013). Characterization of Local Chickens in Selected Districts of the Southern Highlands of Tanzania: I. Qualitative Characters. Livestock Res. Rural Dev. 25: Article #153.
- Ige, A.O., A.E. Salako, A. Yakubu, and S.A. Adeyemi (2012). Qualitative Traits
Characterization of Yoruba and Fulani Ecotype Indigenous Chickens in Derived
Savannah Zone of Nigeria. Int. J. Poult. Sci. 11(10): 616-620. https://doi.org/10.3923/ijps.2012.616.620
- Markos, S., B. Belay, and T. Astatkie (2017). Evaluation of Egg Quality Traits of Three Indigenous Chicken Ecotypes Kept Under Farmers’ Management Conditions. J. Poult. Sci.16: 180-188. https://doi.org/10.3923/ijps.2017.180.188
- Melesse, A., and T. Negesse (2011). Phenotypic and morphological characterization of indigenous chicken populations in southern region of Ethiopia. Anim. Genet.
49: 19-31. https://doi.org/10.1017/S2078633611000099
- Minga, U.M., P.L. Msoffe, and P.S. Gwakisa (2004). Biodiversity (variation) in disease resistance and in pathogens within rural chicken populations. In International Health Network for Family Poultry (INFD). World Poultry Congress 2004 Jun (pp. 8-13).
- Montgomery, D.C. (2020). Design and analysis of experiments. 10th ed. Wiley, New York, USA.
- Olawunmi, O.O., A.E. Salako, and A.A. Afuwape (2008). Morphometric Differentiation and Assessment of Function of the Fulani and Yoruba Ecotype Indigenous Chickens of Nigeria. J. Morphol.26(4): 975-980. http://dx.doi.org/10.4067/S0717-95022008000400032
- Pagani, P., and A. Wossene (2008). Review of the new features of the Ethiopian poultry sector. Biosecurity implications. Food and Agriculture Organizations, 3-4. Rome, Italy.
- SAS (2014). SAS/STAT® 9.4 User’s Guide. SAS Institute Inc., Cary, NC, USA.
- Semakula, J., P. Lusembo, D.R. Kugonza, D. Mutetikka, J. Ssennyonjo, and M. Mwesigwa (2011).Estimation of live body weight using zoometrical measurements for improved marketing of indigenous chicken in the Lake Victoria basin of Uganda. Livestock Res. Rural Dev. 23: Article #170.
- Shafiq, M., A. Mahmud, J. Hussain, A. Basheer, S. Mehmood, M.T. Khan, S. Ahmad, and M. Asif (2018). Comparative production performance of four different naked neck chicken phenotypes in Pakistan. The J. Anim. Plant Sci. 28(1): 33-37.
- Tareke, M., B. Assefa, T. Abate, and E. Tekletsadik (2018). Evaluation of morphometric differences among indigenous chicken populations in Bale zone, Oromia Regional State, Ethiopia. Sci. J.6(2): 181-190. http://dx.doi.org/10.22069/PSJ.2018.14974.1329
- Terfa, Z.G., S. Garikipati, G.T. Kassie, T. Dessie, and R.M. Christley (2019). Understanding Farmers’ Preference for Traits of Chickens in Rural Ethiopia. Agric. Econ. 50: 451-463. https://doi.org/10.1111/agec.12502.
- Yakubu, A., D. Kuje, and M. Okpeku (2009). Principal components as measures of size and shape in Nigerian indigenous chickens. Thai J. Agric. Sci. 42(3): 167-176. http://dx.doi.org/10.1590/s1806-92902017001000001
|


