LAND USE AND LAND COVER CHANGES IN A HUMAN-WILDLIFE MEDIATED LANDSCAPE OF SAVE VALLEY CONSERVANCY, SOUTH-EASTERN LOWVELD OF ZIMBABWE
C. Mashapa*, E. Gandiwa, N. Muboko and P. Mhuriro-Mashapa
School of Wildlife, Ecology and Conservation, Chinhoyi University of Technology, Private Bag 7724, Chinhoyi, Zimbabwe
*Corresponding author: clayiemashapa@yahoo.co.uk
ABSTRACT
The study aimed to map and predict land use and land cover change dynamics in a human-wildlife mediated landscape of Save Valley Conservancy (SVC), south-eastern lowveld of Zimbabwe. In April 2018, remote sensing was used to quantify land use and land cover changes between 1990 and 2015 based on satellite images acquired from North Atlantic Space Agency (LANDSAT TM, path 170 raw 73). Household surveys were administered using a structured questionnaire to 100 communal settlers to collect biophysical/socioecological data on explanatory variables which included; density of human and livestock, fuelwood consumption and area under cultivation. The study used multi-criteria evaluation procedure based on dynamic adjustments of socio-ecological data to generate transitional probability maps of SVC. Thresholds of socio-ecological data were then computed in the Markov-cellular automata model through a multi-objective land allocation procedure and a cellular automata spatial filter in order to simulate future land use and land cover maps of 2020, 2030 and 2040 for SVC. If the Zimbabwe land reform and its agricultural resettlement program is not properly coordinated and planned in the study area, the study predicted a continuing downward trend in woodland cover category and a significant upward trend of land under agriculture. For the period 1990 to the 2040s, the woodland cover is likely to decrease by 46.7% changing into agricultural land use and/or bare land in SVC. Future land use and land cover simulations indicated that if the current land use and land cover trends continue unabated across the study area without a holistic sustainable agricultural land-wildlife management plan and community development measures, severe woodland degradation will occur. The study recommends ecological restoration and/or re-planning on agriculture-wildlife land use and zonation, delineating agriculture and human settlement in the southern part of the conservancy while the northern part of SVC is exclusively reserved and protected for wildlife management.
Key words: Land use, land cover, human encroachment, protected area, savanna.
https://doi.org/10.36899/JAPS.2021.2.0246
Published online October 03,2020
INTRODUCTION
The Save Valley Conservancy (SVC), in the south-eastern lowveld of Zimbabwe is of global significance for the characteristic mega-fauna and flora of Africa (ZPWMA, 2010). The SVC is part of the Great Limpopo Transfrontier Conservation Area of southern Africa, hence, forms part of the protected area system in Zimbabwe and stand as an important wildlife cog in the sub-Saharan savanna ecosystem. The sub-Sahara Africa savanna ecosystem has the highest diversity of wildlife and has sustained multispecies fauna and flora conservation systems for millennia (Du Toit and Cumming, 1999). However, the geo-spatial and temporary distributions of many species in sub-Sahara Africa have been reduced due to excessive hunting, pastoralism and human encroachment onto protected areas and wildlife habitat modification among other factors (Bonnington et al., 2007; Kideghesho et al., 2006; Mamo and Bekele, 2011). Protected area systems in Zimbabwe include conservancies that are established to conserve wildlife and to preserve biodiversity and are normally defined as landscapes of ‘undisturbed wilderness’ (Wels, 2003; ZPWMA, 2010). The human encroachment into protected areas causes land fragmentation, degradation of woodland ecosystem and habitat loss due to expanding anthropogenic activities into protected areas that are triggered mainly by such factors as human poverty, human demographic factors, socio-economic policies and land tenure systems (Kideghesho et al., 2006).
The conservancy concept, just like the national park concept in Zimbabwe involves the exclusion of people from wildlife areas except tourists and employees concerned with management (Eltringham, 1990). However, human encroachment into protected areas like the SVC is perceived to have increased at the backdrop of the Zimbabwe land reform programme over the past decades and the encroachment is associated with the extirpation of some species, particularly the large mammals and woody plants (Eltringham, 1990). Human encroachment into the SVC reportedly heightened in the year 2000 following the onset of the Zimbabwe’s fast track land reform programme with a record of incremental changes in human density and spatial expansion of human settlement in protected areas in the south-eastern lowveld of Zimbabwe (ZimStats, 2013; Gandiwa et al., 2011; Kahuni et al., 2014; Mashapa, 2018).
The human encroachment into protected areas is perceived to be threatening the woody vegetation and its provision of ecosystem services to wildlife and mankind. Human-wildlife conflicts have been reported across SVC with local people engaging in poaching, whereas, large herbivores reportedly damage crops while large carnivore prey on livestock (Lindsey, 2008; Mhuriro-Mashapa et al., 2017; Matseketsa et al., 2019). Thus, human-wildlife conflicts in south-eastern Zimbabwe threaten agriculture-based livelihoods, thereby influencing farmers to expand their agricultural land use to mitigate losses (LeBel et al., 2011; Mhuriro-Mashapa et al., 2018; Mashapa et al., 2019). An understanding of land use and land cover changes is fundamental in human and wildlife mediated land use management for ecological restoration, especially for game and woodland management in the SVC. This study adopted the definition of land use based on how humans exploit land cover and is defined by management practices such as game ranching, agriculture, logging and conservation (Campbell et al., 1996). Land use changes were recorded as consequences of intervening factors which can result from varying land utilization of the human-wildlife-environment system (Lambin et al., 2003). Whereas, land cover depicts the physical environment of the landscape, e.g., woodland, agricultural land, grassland, bare land and water.
The present study aims to fill a knowledge gap on the recent land use and land cover changes in a landscape formerly reserved for wildlife, but now partly settled by agricultural communities. Specifically, the study objectives were two-folds, (i) to identify and map the major land use and land cover changes from 1990 to 2015 and (ii) to simulate future land use and land cover changes (2020, 2030 and 2040) in SVC south-eastern lowveld of Zimbabwe. The study is significant and of importance to land use managers especially given the competing claims on land-use in the landscape and other similar areas in Zimbabwe and beyond.
MATERIALS AND METHODS
Study area: The SVC, with an area of about 348, 450 ha, located at latitude 19°50′S-21°00′S and longitude 31°30 ′E-32°30′E, is until recently, a single co-operatively managed wildlife conservancy comprising individual game ranches in Masvingo Province, south-eastern lowveld of Zimbabwe (Fig. 1). In the year 2000, part of SVC was resettled by communal farmers (Pole et al., 2004). The study area is characterised by erratic rainfall pattern with an annual range of 250mm to 550mm (Williams, 2011). Mean monthly maximum temperature is 35°C, whilst mean monthly minimum temperature is 23°C (Gandiwa et al., 2016). The vegetation is predominantly dry deciduous savanna woodland of varying types with Acacia spp, Combretum spp and Colophospermum mopane woodland being the common vegetation types (Cunliffe et al., 2012; Seydack et al., 2012). SVC is endowed by a variety of large herbivores dominated by buffalo (Syncerus caffer), elephant (Loxodonta africana) and impala (Aepyceros melampus) whereas, carnivores are dominated by lion (Panthera leo), spotted hyenas (Crocuta crocuta) and African wild dog (Lycaon pictus) (Williams, 2011).
Sampling design and data collection: The study adopted two step approaches in data collection that consisted of remote sensing for quantifying land use and land cover changes over time and field work on ground truthing to verify land use categories and biophysical/socio-ecological data collection through questionnaires. Five land use and land cover categories namely woodland, agriculture, grassland, bare land and water body were designated based on Williams (2011) supplemented with field observations (Table 1). For the purpose of this study agricultural land use was inclusive of human settlements. The SVC boundary was digitized from the Masvingo provincial administrative map of Zimbabwe using ArcGIS 9.0 software (ESRI, 2004). Land use and land cover changes were quantified across SVC, using remote sensed satellite images acquired from North Atlantic Space Agency (LANDSAT TM, path 170 raw 73).
Table 1. Descriptions of land use and land cover categories for the study area.
|
Land use and land cover category
|
General description
|
|
Woodlands
|
Land covered with woody trees and shrubs forming closed canopies with relatively tall and dense trees.
|
|
Agriculture
|
Land tilled for growing crops. This category includes areas currently under crop or fallow and is inclusive of human settlement
|
|
Grassland
|
Land area with more than 50% covered with grasses (mixed with some shrubs) and less than 50% herbaceous and have open lands usually used for grazing.
|
|
Bare land
|
Area under degraded grass lands and with some areas that are bare ground (including rock outcrops).
|
|
Water body
|
Riverbeds which include sands, gravel, and bed rocks or wetlands, rivers and streams
|
Fig 1. Save Valley Conservancy (SVC) and resettlement area within the protected area. The labels show the names of properties within SVC. Note:Commercial north and commercial south depicts game ranches still operation whereas resettlement shows human communal settlement within the protected area of SVC. Source: Pole et al. (2004).
Land cover images considered for our study were taken before Zimbabwe’s land reform of 2000 (1990 and 1995), during the time of the fast track land reform (2000) and after resettlements (2005 and 2010) for comparative purposes. The acquired images were geo-referenced to the ground and co-registered such that corresponding pixels were matched based on time, which aided to compare specific land cover units over time (Fakarayi et al., 2015; Fayad, 2016). Using hand-held Geographical Positioning System (GPS), the Ground Control Points (GCPs) were collected and used for geo-referencing of all land cover images in relation to the exact location of permanent land features such as hills, river/stream and road junctions. Reflected electromagnetic radiation by earth features in the form of Digital Numbers (DN) as recorded by LANDSAT sensors tend to pose difficulties in comparison of multi-temporal images due to differences in sun angle, sensor angle and flight height among other reasons. In the present study, this challenge was resolved by changing DN values to radiance and then radiance to reflectance using the following formula (Fakarayi et al., 2015);
DN to radiance = (LMAX - LMIN) / 255 * DN + LMIN
Radiance to reflectance: ρp = (π * Lλ * d2) / ESUNλ * COS (Θs)
where:
ρp = planetary reflectance
Lλ = Spectral radiance at sensor’s aperture,
ESUNλ = band dependent mean solar exo-atmospheric irradiance,
Θs = solar zenith angle and
d = earth-sun distance, in astronomical units
Assessment of land use by communal settlers in SVC
In April 2018, household surveys were administered using a structured questionnaire to pre and post 2000 communal settlers, in order to collect biophysical/socioecological data on explanatory variables which included; densities of human and livestock, fuelwood consumption and area under cultivation. A sample size of 100 households was selected from a total of 1,401 households settled in the southern part of SVC. The majority of the households as study respondents were male-headed (n = 74) and the minority were female-headed (n = 26). Sixty percent (60%, n = 60) of the household study respondents’ ages ranged from 30 to 60 years and about 12% (n = 12) were over 60 years old. However, 28% (n = 28) of the respondents were between 18 to 30 years old. Literacy was high as most study respondents reported being educated with 80% (n = 80) of the household heads having received at least primary education. About 82% (n = 82) of the household study respondents were not formally employed and were involved in smallholder rain-fed crop and livestock production. The selected biophysical/socio-ecological data for pre and post 2000 were coded into a geo-data base linked to geo-referenced SVC base maps. Finally, each variable was rasterized and converted into ArcGIS GRID format version 9.0 at a 30-m spatial resolution. Desk review of available literature was conducted to triangulate and record biophysical/socioecological information and related published data on population growth rates of communal settlers, livestock and elephants (Williams, 2011; Dunham and van der Westhuizen, 2015).
Simulation of land use and land cover change over time using Markov-cellular automata model
For simulating land use and land cover changes, we used data layers of SVC boundary overlay and biophysical/socioecological data (densities of human, livestock and elephants as well as population growth rate, respectively, fuelwood consumption, area under cultivation) to produce cross-tabulation of the land use and land cover change/transition matrix based on the 5 years’ time interval over time. In addition, and specifically, a land use and land cover map of SVC for 2015 was produced from the Advanced Space-borne Thermal Emission and Reflection Radiometer (ASTER) data. Elevation was derived from the Masvingo Province digital elevation model (DEM), obtained from the Forestry Commission of Zimbabwe. Dynamic adjustments of transition map thresholds were implemented in the Markov-cellular automata model through a multi-objective land allocation (MOLA) procedure and a cellular automata spatial filter in order to simulate future land use and land cover maps for 2020, 2030 and 2040. For the application of the Markov-cellular automata model in SVC, the following processes were done using algorithms available in IDRISI Kilimanjaro GIS and Image Processing software (1) computation of land use and land cover transition potential maps based on multicriteria evaluation (MCE) procedure, (2) computation of steady state and transition probabilities using Markov chain analysis, and (3) spatial allocation of simulated land use and land cover probabilities based on MOLA and a cellular automata spatial filter (Grundy et al., 2000; Kamusoko et al., 2009).
Data Analysis
Land use and land cover percentage change was cross-tabulated and descriptive analysis of change was performed over the period 1990 to 2015. Using the IDRISI standardization algorithm, we transformed the biophysical/socioecological data into comparable transition potential values that represent the probabilities of land use and land cover category changes (Eastman, 2003). Further, an Analytic Hierarchy Process (Saaty, 1977) was used to compute biophysical/socioecological factor weights based on preference and dominant factors derived from study respondents of the household survey (Table 2). Consistency Ratio (CR) was calculated and a satisfactory result of 0.091 was obtained. If the CR is less than 10%, then the matrix can be considered as having an acceptable consistency (Saaty and Vargas, 2001). Thus, for instance to compute the 2015 woodland transition potential map, woodland change map from 2000 to 2015, and biophysical/socioecological data for 2015 were combined based on a weighted linear combination algorithm (Eastman et al., 1995) using weights derived from the Analytic Hierarchy Process procedure (Table 2), (see, Saaty, 2008). Using the same procedure, we computed the 2000 land use and land cover transition potential maps, using biophysical/socioecological data for 2000.
Table 2. Biophysical/socioecological data weights derived from the Analytic Hierarchy Process (AHP) procedure
|
Biophysical/socioecological factors
|
Weight
|
|
Area under agriculture/cultivation
|
0.20
|
|
Human density
|
0.20
|
|
Fuel wood consumption
|
0.17
|
|
Domestic use of timber
|
0.16
|
|
Elephant density
|
0.11
|
|
Elevation
|
0.09
|
|
Livestock density
|
0.06
|
|
Distance travelled to fetch firewood
|
0.01
|
|
Total
|
1.00
|
Notes; To make comparisons, we used a scale of numbers that indicates how many times more dominant one element is over another element with respect to influence on land use and land cover change in the study area. Table 2 exhibits the scale of 0.01 to 1, with an ascending order of influence on land use and land cover change as recorded in SVC.
Computation of steady state and transition probabilities of the landscape of SVC was done using Markov chain analysis following Pastor et al. (1993), which was used to compute transition probabilities based on the LANDSAT derived land use and land cover maps for 1990, 2000, 2005, 2010 and 2015 (Fig. 2). Two landscape transition matrices were constructed from the cross-tabulation of the land use and land cover maps based on the 10 years’ time interval used for calibration for the periodic transition matrix for the period from 1990 to 2000 and the 15 years’ time interval calibration the periodic transition matrix for the period from 2000 to 2015. Spatial allocation of the simulated land use and land cover probabilities was processed mainly from the three datasets of SVC maps, namely, (1) the preceding initial land use and land cover base map of SVC derived from the LANDSAT, (2) the transition potential maps of SVC, and (3) the periodic transition area matrix, which were integrated using MOLA and cellular automata spatial filter in order to simulate the subsequent land use and land cover map. Cellular automata iterations were specified as either 10 or 15 based on the number of years for the period between land use and land cover maps of SVC derived from LANDSAT.
With each cellular automata pass, each land use and land cover transition map was re-weighted as a result of the contiguity filter, which determines the location of the simulated land use and land cover category (Pontius and Malanson, 2005). Once re-weighted, the revised land use and land cover transition maps were then run through MOLA to allocate say 1/10 or 1/15 of the required land use and land cover in the first run, and 2/10 or 2/15 the second run depending on the specified cellular automata iterations, and so on, until the full allocation of land for each land use and land cover category was obtained (Myint and Wang, 2006). The transition area matrix derived from the Markov chain analysis determines how much land was allocated to a land use and land cover category over the n-year period (Myint and Wang, 2006). At the end of each iteration, a new land use and land cover map of SVC was generated by overlaying all results of the MOLA procedure. For example, three datasets, the 2000 land use and land cover base map, the transitional potential map of 2000 and the 2000-2015 land use and land cover change/transition area matrix, were integrated using MOLA and cellular automata spatial filter in order to simulate the 2015 land use and land cover map, while specifying 15 cellular automata iterations until the end of each iteration where a new land use and land cover map of SVC was generated by overlaying all results of the MOLA procedure. This similar procedure of the Markov-cellular automata model, run through a MOLA procedure and a cellular automata spatial filter was done in order to simulate present maps (2000 and 2015) and future maps (2020, 2030 and 2040) of land use and land cover of SVC, while specifying the corresponding cellular automata iterations for present and future maps until the end of each specific iteration.
RESULTS
Land use and land cover changes
Woodland cover is dominant but decreasing, whereas, agriculture land cover increased over 1990 to 2015 in SVC. (Fig. 2 and Table 3).
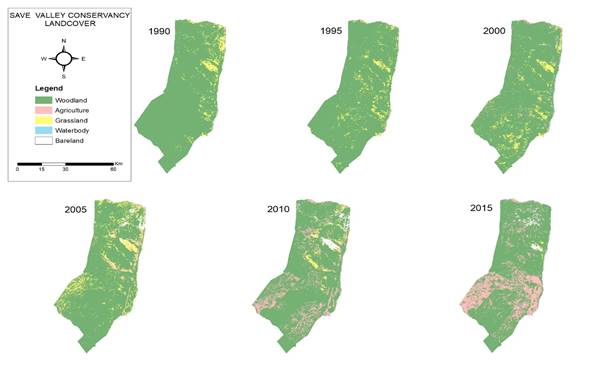
Fig. 2. Land use and land cover maps of Save Valley Conservancy, south-eastern lowveld of Zimbabwe, 1990–2015
During the 1990 to 2015, the woodland cover, grassland and water bodies decreased by less than 92%, while the agriculture and bare land significantly increased by over 6,000% (Table 3). The major land use and land cover changes were mainly from woodland to agriculture areas and bare land by the year 2000 and onwards. The period 1990 to 1995 recorded the minimum loss of woodland cover over the study period.
Table 3. Area of land use and land cover and % changes over time in SVC, 1990-2015.
|
Land use-land cover
|
1990(ha)
|
% change
|
1995 (ha)
|
% change
|
2000 (ha)
|
% change
|
2005 (ha)
|
% change
|
2010 (ha)
|
% change
|
2015 (ha)
|
% change
|
|
Woodland
|
326 727
|
-0.1
|
326 675
|
-3.5
|
315 191
|
-6.9
|
293 338
|
-3.9
|
281 880
|
-7.7
|
260 090
|
-20.4
|
|
Agriculture
|
776
|
40.3
|
1 089
|
530
|
6 864
|
90.3
|
13 064
|
267
|
47 943
|
69.2
|
81 139
|
10 352
|
|
Grassland
|
20 096
|
0.1
|
20 111
|
20.2
|
24 169
|
55.3
|
37 531
|
-70.6
|
11 045
|
-84.8
|
1 677
|
-91.7
|
|
Water body
|
778
|
-41.9
|
452
|
219.4
|
1 444
|
-77.9
|
319
|
-21.4
|
251
|
170.2
|
678
|
-12.9
|
|
Bare land
|
72
|
71.2
|
124
|
532.3
|
782
|
436.8
|
4 198
|
74.6
|
7331
|
-33.6
|
4 867
|
6 638
|
|
Total (ha)
|
348 450
|
|
348 450
|
|
348 450
|
|
348 450
|
|
348 450
|
|
348 450
|
|
The land use and land cover and the respective biophysical/socioecological data of transition probabilities were presented in the transition area matrix for the 1990-2000 and 2000-2015 periods in SVC as formulated based on the frequency distribution of the observations of biophysical/socioecological factors as influencers of land cover change, (Tables 4a & b). The diagonal of the transition probability and transition matrix represents the self-replacement probabilities, that is the probability of a land use and land cover category remaining the same (shown in bold in Tables 4a & b), whereas the off-diagonal values indicate the probability of a change occurring from one land use and land cover category to another. There is a 10-year time lag for the 1990-2000 matrix and 15-year time lag for the 2000-2015 matrix. There were less differences in the normalized transition probabilities for the two time periods: therefore, transition probabilities were used as an input in the Markov-cellular automata model.
Table 4a. Land use and land cover change of steady state and transition area matrix (in ha) for SVC for the period 1990-2000.
| |
2000
|
|
|
|
|
1990
|
Woodland
|
Agriculture
|
Grassland
|
Bare land
|
|
Woodland
|
0.89
|
0.53
|
0.21
|
0.06
|
|
Agriculture
|
0.41
|
0.02
|
0.24
|
0.08
|
|
Grassland
|
0.07
|
0.21
|
0.14
|
0.19
|
|
Bare land
|
0.05
|
0.50
|
0.16
|
0.18
|
Table 4b. Land use and land cover change of steady state and transition area matrix (in ha) for SVC for the period 2000-2015.
| |
2015
|
|
|
|
|
2000
|
Woodland
|
Agriculture
|
Grassland
|
Bare land
|
|
Woodland
|
0.87
|
0.60
|
0.29
|
0.09
|
|
Agriculture
|
0.79
|
0.12
|
0.26
|
0.10
|
|
Grassland
|
0.31
|
0.28
|
0.24
|
0.21
|
|
Bare land
|
0.06
|
0.53
|
0.22
|
0.38
|
Model validation: In order to validate the Markov-cellular automata model to simulate future land use and land cover maps for 2020, 2030 and 2040, we compared data for the simulated land use and land cover categories of SVC for 2000 and 2015 with the respective actual LANDSAT satellite-derived land use and land cover categories based on the Kappa statistic. The overall simulation success was 73% and 87% for 2000 and 2015, respectively based on the Markov-cellular automation. The land categories in the simulated land use and land cover were relatively like the corresponding categories in the actual land use and land cover of SVC for 2015 (Fig. 3). Visual analysis of the 2015 results indicate that simulated woodland and agriculture categories were slightly higher than the actual figures, grassland category was similar between the simulated and actual land use and land cover categories, while the bare land and water body categories were slightly poorly simulated.
Analysis of the simulated land use and land cover categories of SVC in 2000 and 2015 revealed that the Markov-cellular automata model generally underestimated the area of bare land and water body categories (Fig. 3). This could be attributed to the fact that Markov-cellular automata model applies the contiguity rule with strong weighting towards predicting new agriculture land near woodland edges to simulate the land use and land cover category near the existing similar land use and land cover category (Pontius and Malanson, 2005). Thus, since many of the nearby pixels would belong to the land use and land cover category such as woodland or agriculture in case of the present study, high transition potential was maintained, resulting in good simulation of the agriculture and woodland land use and land cover categories due to their relative close proximity. This suggests that the Markov-cellular automata model’s simulation accuracy increases with the proportion of a given land use and land cover category relative to others. Conversely, if few of the nearby pixels were depicted from a land use and land cover category such as bare land or water body, then the transition potential tended to breakdown its weight, which could possibly result in poor simulation of that land use and land cover category.

Fig. 3. Simulated versus actual land use and land cover categories in 2015 for SVC, south-eastern Zimbabwe
Predicted future land use and land cover changes for SVC
Based on the success of the models for 2000 and 2015, we simulated and produced future land use and land cover maps for 2020, 2030, 2040 for SVC (Fig. 4). The Markov-cellular automata model simulations predicted that by the 2040s, woodland cover and grassland in SVC will decrease by 46.7% and 10.5% as compared to the 1990 land use and land cover categories, respectively (Table 5).
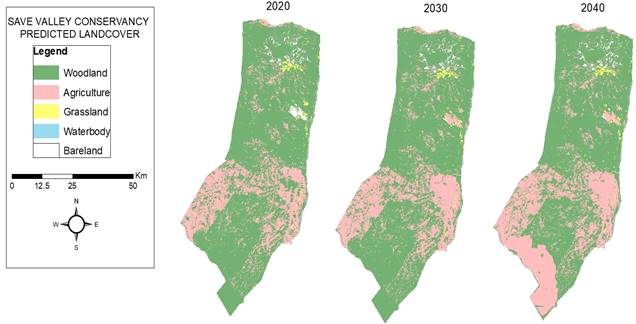
Fig. 4. Simulated future land use and land cover maps of SVC, south-eastern Zimbabwe, 2020, 2030 and 2040
As woodland cover will decrease, thus, land under agriculture and the bare land in SVC will significantly increase by at least 19, 000% and 9, 600% as compared to the 1990 land use and land cover categories, respectively. Conversely, water bodies will decrease by 67.7% as compared to the 1990 status of water body cover in SVC. Generally, the period of 2020 to 2030 is predicted that it will record the relative highest rate of change for most of the land use and land cover categories in SVC south-eastern lowveld of Zimbabwe.
Table 5. Area of land use and land cover and % changes over time in SVC, including the simulated future area of land use and land cover and % changes
|
Land use-land cover
|
1990 (ha)
|
% change
|
2000 (ha)
|
% change
|
2015 (ha)
|
% change
|
2020 (ha)
|
% change
|
2030 (ha)
|
% change
|
2040 (ha)
|
% change
|
|
Woodland
|
326 727
|
-0.1
|
315 191
|
-17.5
|
260 090
|
-7.2
|
241 504
|
-19.2
|
195 019
|
-10.8
|
174 048
|
-46.7
|
|
Agriculture
|
776
|
40.3
|
6 864
|
1 082.1
|
81 139
|
19.9
|
97 248
|
37.8
|
133 970
|
11.3
|
149 132
|
19 100
|
|
Grassland
|
20 096
|
0.1
|
24 169
|
-93.1
|
1 677
|
143.4
|
4 083
|
207.9
|
12 574
|
43
|
17 978
|
-10.5
|
|
Water body
|
778
|
-41.9
|
1 444
|
-53
|
678
|
-27.5
|
491
|
-37.6
|
307
|
-18.1
|
251
|
-67.7
|
|
Bare land
|
72
|
71.3
|
782
|
522.1
|
4 867
|
5.3
|
5 124
|
28.4
|
6 580
|
7
|
7 041
|
9 651
|
|
Total (ha)
|
348 450
|
|
348 450
|
|
348 450
|
|
348 450
|
|
348 450
|
|
348 450
|
|
DISCUSSION
The study sought to map and predict land use and land cover change dynamics in human and wild animal dominated SVC, south-eastern lowveld of Zimbabwe. The study predicted a continuing decreasing trend in woodland cover category and a significant increasing trend of land under agriculture. For the period 1990 to the 2040s, the woodland cover will likely decrease by about 46.7% changing into agricultural land and/or bare land in SVC. The land use and land cover changes have significant environmental and socio-ecological implications for sustainable wildlife land use planning in the protected area of SVC. Taking into consideration the high human population density (36 person km-2) with an annual population growth rate of 4.3% (from 2002 to 2012) settled on the southern part of SVC (ZimStats, 2013), coupled with the high density of elephants (2 elephants km-2) within the fragmented northern part of the conservancy (Dunham and van der Westhuizen, 2015), the simulated future land use and land cover changes highlighted an increasing pressure on land and woodland resources across SVC. For instance, the continuing decline in woodland areas on one hand and the increase in bare land areas on the other hand imply woodland degradation in the future, which potentially threatens wildlife since woodlands provide forage for wild animals.
A synthesis of land use and land cover changes in SVC highlighted that, the period 1990 to 1995 recorded the minimum loss of woodland cover over the study period, whereas, the maximum land use and land cover changes were recorded mainly from woodland to agriculture areas and bare land by the year 2000 to 2015. These varying trends of land cover change over time can be attributed to land use changes experienced in SVC. Originally, SVC was a co-operative structure of individual cattle ranches with no elephants, thus woody vegetation utilization levels and woodland loss would be expectedly minimum pre-1995. However, these connected cattle ranches were then converted into a single co-operatively managed commercial wildlife reserve conservancy in 1993 with the introduction of elephants and other large herbivores (Wels, 2003). Declines in woodland cover related to elephant browsing have been documented in southern Africa for over 50 years (Buechner and Dawkins, 1961 ; Owen-Smith et al., 2006). In areas where elephant density are high, woodlands can be converted to a grasslands (Owen-Smith et al., 2006). This land cover modification mostly takes place through elephant herbivory, including tree toppling, pollarding whole trees, by breaking and removing branches from their canopies and by preventing or reducing woody plant recruitment and regeneration (Balfour et al., 2007 ; Mashapa et al., 2013). However, the spatial variation of elephant impacts on woody vegetation still needs more understanding, given that the relationship between elephant density and the ecological impact of elephants is complex and variable (Balfour et al., 2007). It is difficult to separate elephant influence from that of other causes of tree mortality, including drought (van de Vijver et al., 1999), fire (Higgins et al., 2000) and human activities (Mashapa et al., 2019), especially when interactions among them may occur (De Beer et al., 2006).
With the onset of the Zimbabwe’s ‘fast track’ resettlement programme of 2000, villagers moved into parts of protected areas in Save Valley, southeastern lowveld of Zimbabwe, opening the woodlands for agriculture land use (Rukuni et al., 2006). The land resettlement process of the Zimbabwe land reform programme initially took insufficient account of some of the fundamental requirements for wildlife and woodlands conservation (Fakarayi et al., 2016). Moreover, the introduced elephant population continues to increase over time, with high levels of elephant herbivory in SVC (Dunham and van der Westhuizen, 2015). Thus, the post 2000 to 2015 era in SVC recorded excessive decreasing trend in woodland cover, grassland and water bodies with a relative increase in agricultural land cover and bare land.
The Markov-cellular automata model employed in this study area was able to advance previous research (Paegelow and Olmedo, 2005) by incorporating additional biophysical/socio-ecological factors such as human density, fuelwood consumption, area under the cultivation and elephant density which determined the quantity and location of the simulated future land use and land cover changes, particularly in relation to the decline in woodland areas as land is opened for agricultural crop production. Spatial modelling and empirical evidence support the contention that tropical savanna ecosystems are characterized by local disequilibrium and stability which is determined through a hierarchy of disturbances (Wu and Levin, 1994; Wu and Loucks, 1995; Gillson, 2004; Briske et al., 2005). Thus, it is evident from our present study that anthropogenic disturbance regimes play a key role in determining the status of land use and land cover in the SVC where land use has changed from protected wildlife area to agriculture and human resettlement area (Rukuni et al., 2006; Scoones et al., 2010). Zimbabwe land reform programme is attributed to the decline of woodlands and significant increase of agricultural activities within the protected area of SVC. Communal settlers moved into the protected area and cleared the land required for their agricultural and settlement needs, and this has fragmented SVC (Pole, 2006).
Elsewhere, in Gwayi Forest reserve of Zimbabwe, communal settlers invaded this protected area and cleared woodland for agriculture and settlement land use without acquiring permission from the Forestry Commission of Zimbabwe (Gwaai Working Group, 1997). Generally, they attempted to exercise usufructuary rights regardless of the Forestry Commission’s claim of land tenure and forest resources (Bradley and McNamara, 1993; Kamusoko et al., 2009). Relatedly, communal settlers invaded and cleared woodland for agriculture and settlements in northern Gonarezhou National Park and Chiredzi River Conservancy, south eastern Zimbabwe (Kahuni et al., 2014; Zisadza-Gandiwa et al., 2014; Gandiwa et al., 2011). Rural people in Zimbabwe, use woody plants mainly as sources of firewood and building material and clear the areas for cultivation (Muboko et al., 2013). It is likely that more land under woodland cover will be cleared for agricultural use within SVC. Literature review confirmed that with the onset of Zimbabwe’s land reform program in 2000 there was a significant increase in land use conversion to agricultural settlement with estimated 11 371 huts/houses along with 15 098 cattle and 5 472 sheep/goats, greatly increasing the risk of disease transmission between wildlife and domestic animals in SVC (Dunham and van der Westhuizen, 2015). Future land use and land cover simulations indicated that if the current agricultural settlement trend continues unregulated in the study area without a holistic sustainable agricultural land-wildlife management and community development plan, severe woodland degradation will occur.
In the next 20 years or so, with the rising human population (ZimStats, 2013), the increasing elephant density (Dunham and van der Westhuizen, 2015) and the resultant diminishing woodland cover mainly due to agricultural land clearance and livestock grazing, it is predicted to cause woodland degradation in SVC. This has negative implications on the viability of wildlife management in SVC considering that woodland ecosystems play a key role in sustaining food chains across trophic levels of species (Bradley and Dewees, 1993). It is important for communal settlers, the local rural district council in Zimbabwe, the management of SVC, the Zimbabwe Parks and Wildlife Management Authority and the Zimbabwe Ministries responsible for land, environment and agriculture to invest in land use planning and zonation to delineate the communal farming settlement from the wildlife areas and this will result in benefits to all stakeholders. Furthermore, there is need to invest in the long-term sustainability of the natural resources of SVC by re-planning and adopt the Wildlife Based-Land Reform Policy and Resettlement allowing proper demarcation of land use at the human-wildlife interface. Importantly, eco-tourism is presently one of the fastest growing industry in Zimbabwe (ZimStats, 2013), and SVC could potentially be of high value for tourism, as it is part of the Great Limpopo Trans-frontier Conservation Area. Thus, the present study provided insights towards ecological restoration and/or sustainable land and wildlife management of SVC and similar protected wildlife areas in savanna ecosystems that are prone to human encroachment.
Conclusion: The study model predicted a significant 46.7% reduction of woodland cover on or before 2040, likely to cause woodland degradation thereby negatively affecting the viability of wildlife management in SVC. It is important to note that the model likely did not capture all the intricacies of land use and land cover changes and should not be interpreted too literally. Similarly, the influence of the slight over estimation of the woodland and agricultural land categories needs to be taken into consideration in interpreting the simulated maps. However, the scientific information on present and future land use and land cover change for SVC, could contribute to decision-making in land use planning and re-zonation to delineate farming settlements from the remainder of the protected wildlife area.
Acknowledgements: We are grateful to the management of Save Valley Conservancy, the Zimbabwe Parks and Wildlife Management Authority, Forestry Commission of Zimbabwe, Chipinge and Chiredzi District Administrators who granted permission for this study. Sincere in-depth gratitude goes to K. E. Nyamwanza, M. Karinda, M. Mudhluli, T. Muhlahlubi, T. Chinho, and T. Kaunda for the support in field data collection.
REFERENCES
- Balfour, D., H. T. Dublin, J. Fennessy, D. Gibson, L. Niskanen, and I. J. Whyte (eds.). (2007). Review of Options for Managing the Impacts of Locally Overabundant African Elephants. IUCN, Gland, Switzerland, p. 80.
- Bonnington, C., D. Weaver, and E. Fanning (2007). Livestock and large wild mammals in the Kilombero Valley, in southern Tanzania. Afr. J. Ecol., 44(45): 658-663.
- Bradley, P. N., and K. McNamara, (eds) (1993). Living with Trees: Policies for Forestry Management in Zimbabwe, Word Bank Technical Paper No. 210, World Bank, Washington.
- Bradley, P. N., and P. Dewees (1993). Indigenous woodlands, agricultural production and household economy in the communal areas. In: Bradley, P.N., McNamara, K. (Eds.), Living with Trees: Policies for Forestry Management in Zimbabwe. The World Bank, Washington DC, pp. 63-138. World Bank Technical Paper 210.
- Briske, D. D., S. D. Fuhlendorf, and F. E. Smeins (2005). State-and-transition models, thresholds, and rangeland health: a synthesis of ecological concepts and perspectives. Range Ecol. and Manage., 58:1-10.
- Buechner, H. K., and K. Mc Dawkins (1961). Vegetation change induced elephants and fire in Merchison Falls National Park, Uganda. Ecology, 42: 752-766.
- Campbell, B. M., P. Frost, and N. Byron (1996). Miombo woodlands and their use: an overview and key issues. In: Campbell B (ed.), Themiombo in transition: woodlands and welfare in Africa. Bogor: Centre for International Forestry Research. pp 1-5.
- Cunliffe, A. M., R. E. Brazier, and K. Anderson (2012). Ultra-fine grain landscape-scale quantification of dryland vegetation structure with drone-acquired structure-from-motion photogrammetry. Rem. Sens. Env., 183: 129-143.
- De Beer, Y., W. Killian, W. Versfeld, and R. J. Van Aarde (2006). Elephant and low Rainfall alter woody vegetation in Etosha National Park, Namibia. Conservation Ecology Research Unit, Department of Zoology and entomology, University of Pretoria, Pretoria 0002, South Africa.
- Du Toit, J. T., and D. H. M Cumming (1999). Functional significance of ungulate diversity in African savannas and the ecological implications of the spread of pastoralism. - Biodivers Conserv., 8: 1643-1661.
- Dunham, K. M., and H. F. van der Westhuizen (2015). Aerial Survey of Elephants and other Large Herbivores in Gonarezhou National Park and Save Valley Conservancy, Harare
- Eastman, J. R. (2003). Idrisi Kilimanjaro, guide to GIS and image processing. Clark Univ Ed. 328 pp.
- Eastman, J. R., W. Jin, P. A. K. Kyem, and J. Toledano (1995). Raster procedures for multi-criteria/multi-objective decisions. Photogr. Eng. & Rem. Sens., 61: 539-547.
- Eltringham, S. K. (1990). Wildlife carrying capacities in relation to human settlement. Koedoe, 33: 87-97
- ESRI. 2004. ArcView GIS: The geographic information systems for everyone. Redlands, CA, USA. 572 pp.
- Fakarayi, T., C. Mashapa, E. Gandiwa, and S. Kativu (2015). Pattern of land-use and land cover changes across Driefontein Important Bird Area, Zimbabwe. Trop. Conserv. Sci., 8 (1): 274-283.
- Fakarayi, T., C. Mashapa, E. Gandiwa, and S. Kativu (2016). Varying Land-Use Has an Influence on Wattled and Grey Crowned Cranes' Abundance and Distribution in Driefontein Grasslands Important Bird Area, Zimbabwe. PLoS ONE 11(11) : e0166209. doi: 10.1371/journal.pone.0166209.
- Fayad, I., N. Baghdadi, S. Guitet, J. S. Bailly, and B. Hérault (2016). Aboveground biomass mapping in French Guiana by combining remote sensing, forest inventories and environmental data. International Journal of Applied Earth Observation and Geo, Elsev., 52: 502 - 514.
- Gandiwa, E., I. M. A. Heitkönig, P. H. C Eilers, and H. H. T. Prins. (2016). Rainfall variability and its impact on large mammal populations in a complex of semi-arid African savanna protected areas. Trop. Ecol. 57(2), pp. 163-180.
- Gandiwa, P., M. Matsvayi, M. M. Ngwenya, and E. Gandiwa, E. (2011). Assessment of livestock and human settlement encroachment into northern Gonarezhou National Park, Zimbabwe. J. Sustain. Dev. in Afr. 13, pp. 19-33.
- Gillson, C. (2004). Testing non-equilibrium theories in savannas; 1400 years of vegetation change in Tsavo National Park, Kenya. Ecol. Complexity 1: 281-298
- Grundy, I., J. P. Turpie, and C. Jagger (2000). Implications of co-management benefits from natural resources for rural households in north-western Zimbabwe. Ecol. Econ., 33: 369-381
- Gwaai Working Group (1997). Local-Level Valuation of Village Woodlands and State Forests: Cases from Matabeleland South in Zimbabwe. Institute of Environmental Studies, University of Zimbabwe, Harare IES Working Paper No. 7.
- Higgins, S. I., W. J. Bond, and W. S. W. Trollope (2000). Fire, resprouting and variability: A recipe for grass-tree coexistence in savanna. J. Ecol., 88: 213-229.
- Kahuni, T., P. Zisadza-Gandiwa, W. Mhlanga, E. Libombo, C. Mashapa, N. Muboko, and E. Gandiwa (2014). Are fences effective in combating human-wildlife conflicts around protected areas in Zimbabwe: The case study of local communities bordering northern Gonarezhou National Park, Zimbabwe. In: Mararike, C. G. (ed). Land: An Empowerment Asset for Africa: The Human Factor Perspective. University of Zimbabwe Publications, pp. 278-287
- Kamusoko, C., M., B. Aniya, and A. M. Manjoro (2009). Rural sustainability under threat in Zimbabwe – Simulation of future land use/cover changes in the Bindura district based on the Markov-cellular automata model. App. Geo., 29: 435-447
- Kideghesho, J. R., J. W. Nyahongo, S. N. Hassan, T. C. Tarimo, and N. E. Mbije (2006). Factors and ecological impacts of wildlife habitat destruction in the Serengeti ecosystem in northern Tanzania. AJEAM-RAGEE, 11: 917-932.
- Lambin, E. F., H. J. Geist, and E. Lepers (2003). Dynamics of land-use and land-cover change in tropical regions. Ann. Rev. Environ. & Res., 28: 205-241.
- Le Bel, S., A. Murwira, B. Mukamuri, R. Czudek, R. Taylor, and M. La Grange 2011. HumanWildlife Conflicts in Southern Africa: Ridingthe Whirl Wind in Mozambique and inZimbabwe. In J. López-Pujol (Ed.). Mertens, A., Promberger, C & Gheorge, P. 2002. Testing and implementing the use of electric fences for night corrals in Romania. Carnivore Damage Prevention News, 5: 2-5.
- Lindsey, P. (2008). Human-elephant conflict in and around Save Valley Conservancy. Save Valley Conservancy report, 38 pp.
- Mamo, Y, and A. Bekele (2011). Human and livestock encroachments into the habitat of Mountain Nyala (Tragelaphus buxtoni) in the Bale Mountains National Park, Ethiopia. Trop. Ecol., 52: 265-275.
- Mashapa, C., E. Gandiwa, and N. Muboko (2019). Socio-economic and ecological outcomes of woodland management in Mutema-Musikavanhu communal areas in Save Valley, southeastern lowveld of Zimbabwe. The J. Anim. & Plant Sci., 29 (4): 1075-1087.
- Mashapa, C., P. Zisadza-Gandiwa, E. Gandiwa, and S. Kativu (2013). Abundance and structure of African baobab (Adansonia digitata) across different soil types in Gonarezhou National Park, Zimbabwe. Int. J. Biodiver., 2013: Article ID 874713, 7 pages.
- Mashapa, C (2018). Human livelihoods and Sustainable Conversation: Herbivory and Anthropogenic impacts on woody vegetation and ecosystem goods in Save Valley, south-eastern lowveld of Zimbabwe. DPhil Thesis, Chinhoyi University of Technology, Chinhoyi.
- Matseketsa, G., N. Muboko, E. Gandiwa, D. M. Kombora, and G. Chibememe (2019). An assessment of human-wildlife conflicts in local communities bordering the western part of Save Valley Conservancy, Zimbabwe. Global Ecol. & Conserv., 20: https://doi.org/10.1016/j.gecco.2019.e00737
- Mhuriro-Mashapa, P, E. Mwakiwa, and C. Mashapa (2018). Socio-economic impact of human-wildlife conflicts on agriculture-based livelihood in the periphery of SVC, southern Zimbabwe. The J. Anim.& Plant Sci., 28(3): 904-913.
- Mhuriro-Mashapa, P., E. Mwakiwa, and C. Mashapa (2017). Determinants of communal farmers’ willingness to pay for human-wildlife conflict management in the periphery of Save Valley Conservancy, south eastern Zimbabwe, The J.Anim. & Plant Sci., 27(5): 1678-1688.
- Muboko, N., M. R. Mushonga, N. Chibuwe, C. Mashapa, and E. Gandiwa (2013). Woody vegetation structure and composition in Mapembe Nature Reserve, eastern Zimbabwe. J. App. Sci. & Environ. Manage., 17 (4): 475-481.
- Myint, S. W., and L. Wang (2006). Multi-criteria decision approach for land use land cover change using Markov chain analysis and a cellular automata approach. Canadian J. Rem. Sens., 32(6): 390-404.
- Owen-Smith, N., G. I. H. Kerley, B. Page, R. Slotow, and R. J. Van Aarde (2006). A scientific perspective on the management of elephants in the Kruger National Park and elsewhere. S. Afr. Sci., 102: 389-394.
- Paegelow, M., and M. T. C. Olmedo (2005). Possibilities and limits of prospective GIS land cover modelling – a compared case study: Garrotxes (France) and Alta Alpujarra Granadina (Spain). Int. J. Geo. Inform. Sci., 19(6): 697-722
- Pastor, J., J. Bonde, C. Johnston, and R. J. Naiman (1993). Markovian analysis of the spatially dependent dynamics of beaver ponds. In R. H. Gardner (Ed.), Predicting spatial effects in ecological systems. Lectures on mathematics in the life sciences, 23: 5-27. Providence, RI: American Mathematical Society.
- Pole, A. (2006). Management plan for the Save Valley Conservancy, unpublished report.
- Pole, A., I. Gordon, M. Gorman, and M. MacAskill (2004). Prey selection by African wild dogs (Lycaon pictus) in southern Zimbabwe. J. Zool., 262: 207-215.
- Pontius, R. G., and J. Malanson (2005). Comparison of the structure and accuracy of two land change models. Int. J. Geo. Inform. Sci., 19(2): 243-265.
- Rukuni, M., P. C. Tawonezvi, C. Eicher. C. Munyuki-Hungwe, M., and P. Matondi (eds) (2006). Zimbabwe’s Agricultural Revolution Revisited, Univ. Zimbabwe Pub. Harare.
- Saaty, T. L. (2008). Decision making with the analytic hierarchy process. Int. J. Services Sciences 1 (1), pp. 83-98.
- Saaty, T. L., and L. G. Vargas (2001). Models, methods, concepts and application of analytic hierarchy process. Boston, USA: Kluwer Academic Publishers. 333 pp.
- Saaty, T. L. (1977). A scaling method for priorities in hierarchical structures. J. Math. Psycho., 15: 234-281.
- Scoones, I., N. Marongwe, B. Mavedzenge, J. Mahenehene, F. Murimbarimba, and C. Sekume (2010). Zimbabwe's land reform: myths and realities. James Currey, Woodbridge.
- Seydack, A. H., C. C. Grant, I. P. Smit, W. J. Vermeulen, J. Baard, and N. Zambatis (2012). Large herbivore population performance and climate in a South African semi-arid savanna. Koedoe, 54:1-20.
- Twyman, C. (2001). Natural resource use and livelihoods in Botswana’s wildlife management areas. App. Geo., 21: 45-68.
- van de Vijver, C. A. D. M., C. A. Foley, and H. Olff (1999). Changes in the woody component of an East African savanna for 25 years. J. Trop. Ecol., 15: 545-564.
- Wels, H. (2003). Private wildlife conservation in Zimbabwe: Joint ventures and reciprocity. Brill, Leiden.
- Williams, (2011). The impact of land reform in Zimbabwe on the conservation of cheetahs and other large carnivores. PhD thesis, Durham University. Available at Durham E-Theses, Online: http://etheses.dur.ac.uk/3410/
- Wu, J. G., and S. A. Levin (1994). A spatial patch dynamic modelling approach to pattern and process in an annual grassland. Ecol Monogr., 64(4): 447-464
- Wu, J. G., and O. L. Loucks (1995). From balance-of-nature to hierarchical patch dynamics: a paradigm shift in ecology. Q. Rev. Biol., 70:439-466
- ZimStats (Zimbabwe National Statistical Agency) (2013). Population Census, Census 2012: Zimbabwe Main Report. Harare, Zimbabwe: ZimStats.
- Zisadza-Gandiwa, P., E. Gandiwa, C. Mashapa, E. Mpofu, and N. Muboko (2014). Land use change in Chiredzi River Conservancy, southeast Zimbabwe: Implications for wildlife conservation. In: Mararike, C. G. (ed). Land: An Empowerment Asset for Africa: The Human Factor Perspective. University of Zimbabwe Publications, pp. 266-277
- ZPWMA (Zimbabwe Parks and Wildlife Management Authority) (2010). Gonarezhou National Park General Management Plan (2011-2021). (ed. E. Gandiwa, ZPWMA). Ministry of Environment and Natural Resources Management Harare
|


