ASSESSMENT OF SOIL QUALITY FOR AQUACULTURE ACTIVITIES FROM FOUR DIVISIONS OF PUNJAB, PAKISTAN
J. Shafi*, K. N. Waheed, Z. S. Mirza and M. Zafarullah
Fisheries Research and Training Institute, Lahore, Pakistan
* Corresponding Author Email Address: javairiamalik@gmail.com
ABSTRACT
Present study was based on determination of soil quality to assess its suitability for aquaculture activities from thirty-one selected areas situated in four division of Punjab. Results indicated that soil particle size distribution was suitable for construction of fish ponds at most of the sites in Lahore and Sahiwal. In Gujranwala, about 50% of soil samples contained higher sand content (>60%). Clay particles were found to be less than 25% in 75% of the soil samples whereas sand content was higher than 50% in 25% of the samples collected from Sargodha division. Higher soil pH (>7.0) found at all sites showed calcareous nature of soil and indicated that liming soil to increase pH was not a necessity in these areas. Soil at all the studied areas of Sargodha was found to be saline or very strongly saline except at Village Hernali in Mianwali district. It was found that about 83%, 100% and 80% of sites studied in Lahore, Sahiwal and Sargodha can be used for fish culture respectively. However, none of the site in Gujranwala was found to be suitable for aquaculture if used in present form. Appropriate soil management techniques can be adopted to use the land with unsuitable soil particle size distribution for aquaculture. Saline nature of soil in Sargodha division must be considered while selecting cultureable species of fish/ shrimps in these areas.
Keywords: Aquaculture, site selection, soil salinity, particle size distribution, clay turbidity, water seepage
https://doi.org/10.36899/JAPS.2021.2.0244
Published online October 03,2020
INTRODUCTION
Among the world food production sectors, aquaculture has the potential to cope up with the global issues of food security, poverty and malnutrition (Aloo et al., 2017). Nevertheless, development and expansion of this sector as well as the sustainability of all production and research based aquaculture activities are dependent on suitability of sites selected during the planning stage. Negligence in appropriate consideration of this factor can lead to stressed cultured organisms, restricted functioning of aquatic ecosystem and even complete failure of aquaculture projects (Frankic and Hershner, 2003). Crucial environmental factors that must be considered while assessing the suitability of a site for extensive and semi-intensive aquaculture operations are climate, land topography & elevation, soil quality and available water sources. Out of these, soil quality is the most significant element used to determine potential of a site for fish culture activities (Siddique et al., 2012; Mustafa and Undu, 2017).
Soil is the material which makes the pond bottom and embankment to hold water for fish culture. Bottom soil establishes equilibrium in the pond ecosystem and, therefore, critically influences growth and survival of cultured species (Ahmed, 2004). Pond soil not only acts as biological filter but also stores and supplies nutrients for basal level organisms of autotrophic and heterophic food webs operating in the pond. In addition, physical and chemical characteristics of soil control stability of pond bottom and chemical parameters of overlying water.
Most of the challenging issues encountered during fish farming are linked with soil quality e.g. control of water seepage, clay turbidity in pond water, unsuitable water pH due to soil basicity or acidity. It is, therefore, necessary to assess the soil characteristics in order to decide about land suitability for fish culture and adopt the efficacious soil management practices to increase the productivity of aquaculture projects. A number of earlier studies have evaluated the effect of aquaculture on soil quality (Boyd et al., 1994; Siddique et al., 2012; Prihutomo and Hardanu, 2016; Mustafa and Undu, 2017). However, there is a lack of soil analysis that may highlight suitability of soil for construction of aquaculture ponds. Present study, therefore, aims to report soil characteristics and suitability for aquaculture activities at selected areas in 11 districts of Punjab, Pakistan.
MATERIALS AND METHODS
Sample collection: In present study, soil samples were analysed to determine soil suitability for fish pond construction at sites proposed to be used for aquaculture by potential fish farmers. Soil samples were collected during 2016-19 from 31 regions of 11 districts located in four divisions of Punjab. Districts included Lahore, Nankana Sahab, Sheikhupura (Lahore division); Gujranwala, Mandi Bahauddin, Narowal (Gujranwala division); Pakpattan, Okara (Sahiwal division), Sargodha, Khushab, Mianwali (Sargodha division). There were 12 sampling sites in Lahore, 6 in Gujranwala, 3 in Sahiwal and 10 in Sargodha division. A map of sampling sites in various divisions has been shown in Figure 1. The area of proposed farm sites varied from 0.1 acre to 5.0 acre. Random soil sampling technique was adopted at each site. Samples were collected in triplicate from 1 ft., 2 ft. and 3 ft. soil depth at each sampling site. Samples were labelled appropriately and transported to laboratory in polyethylene bags where they were subjected to air drying. Air dried samples were grinded to pass 2 mm mesh screen and stored in polyethylene bags till further analysis.
Sample analysis: Air dried soil samples were analysed for soil particle size distribution, pH, electrical conductivity, salinity and alkalinity.
Soil particle size distribution: Soil texture and content of silt, sand and clay was determined by hydrometer method following the method of Bentone (2003) with slight modification. Calgon solution (5%) containing sodium hexametaphosphate and sodium carbonate was used as dispersant for determination of sand, silt and clay content in soil. An accurately weighed portion of soil sample (50.0 g ± 0.05 g) was mixed with 100 mL of calgon solution in a 1000 ml glass cylinder. The mixture was allowed to stand undistributed overnight and then volume of soil suspension was made up to the mark with distilled water. Soil suspension in the cylinder was mixed thoroughly using a plunger. The plunger was removed and a soil hydrometer was placed immediately in soil sample suspension. Hydrometer reading of suspension was recorded after 40 seconds. Temperature of soil water slurry was also observed at the same time. Soil suspension was left undisturbed and hydrometer & temperature readings were again recorded after 2 hours. Hydrometer readings at 40 seconds and 2 hours were also recorded for blank solution containing 100 ml calgon solution diluted to 1000 ml with distilled water. Two Hydrometer readings of soil suspensions (viz. recorded after 40 seconds and 2 hours) were corrected using temperature of samples and hydrometer readings for blank. Content of sand, silt and clay was calculated as follows.
Silt and clay content (%) = (Corrected hydrometer reading recorded at 40 seconds/ soil sample weight) x 100
Clay content (%) = (Corrected hydrometer reading recorded at 2 hours / soil sample weight) x 100
Silt content (%) = (Silt and clay content) – (Clay content)
Sand content (%) =100- (Silt and clay content)
Soil chemical analysis: For chemical analysis, soil sample (100.0 ± 0.01 g) was mixed thoroughly with distilled water (200 ml) for one hour following (Pansu, 2016). pH and electrical conductivity of clear supernatant were measured using pH meter and conductivity meter respectively.
Statistical analysis: Spearman’s correlation coefficient was used to determine bivariate correlation among different soil quality parameters. Correlation analysis was carried out in SPSS version 22 using two tailed test at .05 significance level (Field, 2013).
RESULTS AND DISCUSSION
Results of soil analysis for particle size distribution and chemical parameters have been presented in Table 1 and Table 2 respectively. Correlation analysis of soil parameters has been shown in Table 3.
Soil Particle Size Distribution: Average sand content of soil samples collected from 1 ft. varied from 5.89% at LHR-10 to 56.66% at LHR-11 in Lahore division, 12.67% at GRW-14 to 93.33% at GRW-13 in Gujranwala division, 11.04% at SW-20 to 18.33% at SW-21 in Sahiwal division and 6.67% at SGR-26 to 73.24% at SGR31 in Sargodha division. Lowest and highest sand content of soil at the depth of 2 ft. was found to be 5.58% at LHR-10 and 51.00% at LHR-11in Lahore division, 19.33% at GRW-14 and 93.67% at GRW-13 in Gujranwala division, 8.93% at SW-20 and 27.67% at SW-19 in Sahiwal division and 8.54% at SGR-26 and 69.89% at SGR-31 in Sargodha division respectively. At the depth of 3 ft., sand content varied from 4.64% at LHR-10 to 49.33% at LHR-11, 16.23% at GRW-14 to 93.33% at GRW-13, 15.50% at SW-21 to 26.33% at SW-20 and 12.35% at SGR-28 to 67.27% at SGR-31 in Lahore, Gujranwala, Sahiwal and Sargodha divisions respectively.
Similar to sand content, soil clay content showed wide variation at studied sites. In Lahore division, lowest soil clay content was 9.67% while highest clay level was 72.51% found at LHR-11 and LHR-10 respectively at 1 ft. depth. In Gujranwala and Sahiwal divisions, lowest soil clay content was found to be 2.0% (GRW-13) and 14.18% (SW-21) respectively. In contrast, soil at 1 ft. depth of GRW-16 and SW-20 showed highest clay content (48.84% and 20.81% respectively). In Sargodha, lowest (8.79%) and highest (45.58%) clay content at 1 ft. soil depth was found at SGR-31 and SGR-29 respectively. At the depth of 2 ft., lowest soil clay content was found to be 13.0% (LHR-11), 0.33% (GRW-13), 12.33% (SW-19) and 10.12% (SGR-31) while highest soil clay content was 72.02% (LHR-10), 33.63% GRW-14), 30.49% (SW-20) and 48.20% (SGR-29) in the Lahore, Gujranwala, Sahiwal and Sargodha divisions respectively. At the soil depth of 3 ft., lowest clay content was found to be 13.20% (LHR-2), 2.33% (GRW-13), 10.33% (SW-19) and 10.11% (SGR-31) while highest clay level was 71.99% (LHR-10), 27.67% (GRW-16), 23.81% (SW-20) and 42.40% (SGR-28) in the four divisions.
In Lahore division, lowest soil silt content was found at LHR-10 and highest at LHR-6 and LHR-7. Silt level ranged from 21.60% to 65.33%, 22.40% to 68.65% and 23.37% to 69.29% at 1 ft. 2 ft. and 3 ft. soil depth respectively. Silt content varied from 4.67% (GRW-13) to 57.29% (GRW-17) at 1 ft., 5.00% (GRW-13) to 52.62% (GRW-18) at 2 ft. and 5.30% (GRW-13) to 44.26% (GRW-16) at 3 ft. depth in Gujranwala, 64.67% (SW-19) to 68.15% (SW-20) at 1 ft., 58.65% (SW-21) to 60.58% (SW-20) at 2 ft. and 52.54% (SW-20) to 72.64% (SW-21) at 3 ft. depth in Sahiwal division. In Sargodha division, lowest silt content was observed at SGR-31 and SGR-25 where it was found to be 17.98% (SGR-31), 19.98% (SGR-31) and 21.88% (SGR-25) while highest silt level observed at SGR-27 was 65.18%, 65.95% and 67.57%. at 1 ft., 2 ft. and 3 ft. depth respectively.
Variation in soil characteristics along depth has been reported in earlier studies that investigated soil quality in context of aquaculture. (Boyd, 1976; Mustafa and Undu, 2017). It seems plausible that quality parameters of upper soil layers may be remarkably different from deeper soils and it is advantageous to analyse soil characteristics along certain depth as bottom soil need to be excavated during pond construction & management. Therefore, soil samples collected from different depths were subjected to mechanical and chemical analysis in the present investigation
Soil texture depends on relative distribution of particles and their shape and size. Soils separates include coarse-grained particles with particle size 0.01–2.0 mm (e.g. gravel and sand) and fine grained particles with particle size of 0.05-0.002 mm for silt and less than 0.002 mm for clay (Boyd, 2003). Relative percentage of sand, silt and clay in soil is very important parameter that influences suitability of soil for fish farming (Mischke, 2012). Problems associated with water seepage and sediment erosion can be avoided effectively by proper construction of embankments and sufficiently compacted pond bottom soil that can only be accomplished if soil contains suitable content of sand, silt and clay (Bunting, 2013). It is, therefore, necessary to determine soil texture class and relative content of soil particles before construction of pond. Soil that is considered as suitable for construction of pond bottom and embankments should be well graded with wide range of different sized particles. High sand content in soil will not only lead to excessive water infiltration rates from pond bottom and embankments but also cause degradation of underground water quality due to percolation of exogenous chemicals along with seeped water (Tucker and Hargreaves, 2009). Moreover, pond soil should have a clay content of greater than 35% according to the earlier recommendations (Hajek and Boyd, 1994). However, it was found later that soil with high clay content is difficult to work during pond construction and compaction due to its cohesive nature and plasticity. In addition, high clay content in soil can interfere indirectly with fish production by clogging fish gills and causing turbidity in ponds that may restrict sunlight and primary production. High soil clay content can also cause degradation of receiving water bodies. Recommendations on soil clay content are, therefore, revised and soil with clay content of about 15% is recommended as suitable for fish ponds. Moreover, it was suggested that soil with clay content of 5-10% can be used for pond embankments if it contains suitable distribution of particles of different sizes (Boyd et al., 2002).
In present study, particle size distribution of soil at most of the investigated sites in Lahore division was found to be suitable for fish ponds construction. However, soil at Village Kala Khatai in Narang Mandi, situated in Sheikhura district contained high content of clay (>70%) in samples collected from three depths that rendered this site (in present form) unsuitable for aquaculture. Soil at Sangla Hill in Nankana Sahab district contained high sand content (>49%) that would lead to high water seepage in constructed ponds. This site can be used with the aid of suitable soil management techniques such as soil lining with impervious material or addition of clay minerals. Sand content was less than 40% and clay content was less than 30% in 75 percent of the soil samples collected from Lahore district (3 ft. depth; Figure 2).
In Gujranwala, two sites; Phalia in Mandi Bahauddin district and Village Bhatli in Narowal district contained soil with high sand content (>74%) and low clay content (<5%) in all the samples collected from different soil depths. Soil at two sites of Village Heeran, in Narowal district contained higher sand content at 2 ft. (>40%) and 3 ft. (>60%). Soil at Kotli Nu in Gujranwala district and Village Sakantra in Narowal district contained high percentage of clay (>30%) in samples collected from 1-3 ft. of former site and 1 ft. & 2 ft. depth of later site. However, soil at 3 ft. depth of Village Sakantra contained 27.67% clay. Relatively lower clay content at 2-3 ft. depth indicates that soil at deeper depths (greater than 3 ft.) of this site can be investigated for suitable particle size distribution with low clay content. Sand content exhibited wide range i.e. 10%-90% in soil samples of Gujranwala division (3 ft. depth; Figure 2). Level of sand particles was found to be higher than 30% in 75 percent of soil samples while it was higher than 60% in 50 percent of samples. Clay content was less than 10% in 50 percent of collected samples. It is suggested that most of the investigated sites in Gujranwala division require appropriate soil management techniques prior to be used for aquaculture activities.
Relative sand and clay content of soil at the three studied sites of Sahiwal division was suitable for aquaculture. Sand, silt and clay content exhibited narrow range in soil samples (3 ft. Figure 2) of Sahiwal division. Range of sand, silt and clay particles was found to be 15%-30%, 10%-25% and 50%-75% respectively.
In Sargodha division, high sand content (67%) was found at Harnali, Tehsil Peelan in Sargodha district. Relatively high sand content was also found at Chak No. 188/ NB (>40%), Shahpur (>50%) and Kandewala Road (>39%) in Sargodha district. High clay content was found at Village Muhammad Ali Wala and Behak Mekan in Sargodha district where it ranged from 38.57% to 42.403% and 45.58% to 48.21% respectively. Clay content was also relatively high at Chak No. 35/ SB in Sargodha district (30.66% to 34.64%). Clay content in upper soil layer (1 ft.) was found to be 32.0% in Village Sandral situated in Khushab district while it reduced to 18.67% at 3 ft. depth which indicates that soil at deeper site can be used for construction of pond bottom and embankments. Sand content was less than 35% in half of the soil samples of Sargodha division (3 ft. depth, Figure 2) while it was higher than 50% in 25 percent of samples. Silt content ranged from 15% to 80% while in half of the soil samples; it was found in the range of 30%-50%. In 75 percent of soil samples, clay particles were less than 25% (Figure 2). Uzukwu et al. (2011) reported high water seepage in ponds of experimental fish farm at Nigerian Institute for Oceanography and Marine Research and linked it with high sand content. Water seepage was also observed in ponds with appreciable clay content and authors attributed it to increased porosity of soil due to mixing of clay with laterite. Yi et al. (2003) investigated the cause of clay turbidity in Nile tilapia ponds situated in Thailand and evaluated different methods to reduce it. The authors concluded that the main cause of turbidity was erosion from pond embankments that can be covered with rice straw to effectively reduce the run-off.
Soil texture class can be ascertained on the basis of relative percentage of sand, clay and silt particles present in it with the aid of soil texture triangle devised by United States Department of Agriculture (USDA) (Osman, 2013). All the texture classes are not suitable for the construction of fish ponds. Soil texture with high sand (loamy sand, sandy loam, sand) or clay content (clay, silty clay) can render a site unsuitable for aquaculture. In general, silt loam and clay loam classes are considered as suitable for construction of ponds. However, the final recommendation on soil suitability should not be based merely on the texture class in an area but on accurate determination of relative content of soil separates. For example, while silt loam is considered as suitable texture class for aquaculture, clay content of this class can be 0%-27%. Soils with very low clay content <10% are, surely, not acceptable for fish ponds. Prevalence of soil texture classes in four divisions of Punjab studied in present investigation has been compared in Figure 3. Silt loam was the most abundant soil class in Lahore and Sahiwal division found in 43.52% and 74.07% of soil samples respectively. Classification of soil in Guranwala and Sargodha division was more diversified. Soil was designated as silt loam, loam and loamy sand in 20.37%, 18.52% and 18.52% of soil samples in Gujranwala division respectively. In Sargodha division, loam, sandy loam and silt loam were found in 24.44%, 15.56% and 15.56% of soil samples.
Soil pH: Soil pH varied from 7.62-10.23 in soil samples of 1 ft., 7.61-10.22 in samples collected from 2 ft. and 7.61-10.19 in soil of 3 ft. depth in Lahore division. Lowest soil pH was found at LHR-8 and highest at LHR-10. In Gujranwala division, pH range of examined sites was found to range from 7.63-9.92, 7.71-9.91 and 7.62-9.99 at 1 ft., 2 ft. and 3 ft. depth. In Sahiwal and Sargodha division, lowest soil pH was found to be 7.85 (SW-19) & 7.94 (SGR-22) at 1 ft., 7.86 (SW-19) &7.96 (SGR-22) at 2 ft. and 7.80 (SW-19) &7.90 (SGR-26) at 3 ft. depth respectively. Highest soil pH was 8.45 (SW-21), 8.49 (SW-21) & 8.79 (SW-21) in Sahiwal division and 10.06 (SGR-29), 10.04 (SGR-28) & 10.03 (SGR-28) in Sargodha division in samples collected from 1-3 ft. depth respectively.
Higher pH values of soil as found in present study indicated the absence of potential acid sulphate soils in the studied areas. Acid sulphate soil contains sulfidic sediments and generally have a pH of 5.0 -7.0 in wet form that might decrease to 2-3 when dried due to the formation of sulphuric acid under aerobic condition (Thompson, 2018). If such soils act as pond bottoms, refilling of ponds with water can lead to low water pH values that is potentially dangerous for fish and shrimp (Boyd et al., 2002). The observed pH values of the tested soil samples indicated the presence of basic ions (calcium, magnesium, potassium, sodium etc.) on cation exchange sites of soil and very low proportion (or absence) of acidic aluminium ions as exchangeable ions bound on these sites
Soil pH was found to be less than 10.0 in Lahore division except at Village Ladhake in Lahore district and Village Kala Khatai in Sheikhupura district. Moreover, it was greater than 8 at all the studied sites of Lahore division except at Village Nathuki in Lahore district where it was 7.61. Soil pH was between 8.0-9.0 in Gujranwala division at Phalia in Mandibahuddin district and Kotli Nu in Gujranwala district. In Village Bhatli, and two sites of Village Heeran, in Narowal district, it remained between 7.0-8.0. Village Sakantra in Narowal district was the only site where pH of the soil was higher than 9.90. Soil of all examined sites in Sahiwal division showed suitable pH range 7.0-8.50. pH range at most of the sites in Sargodha division was found to be 7.0-8.70 (i.e. at Chak No. 188 NB, Chak No. 35 SB, Cha No. 95 NB, Shahpur & Kandiwala road in Sargodha district, Village Sandral in Khushab district and Village Hernali in Mianwali district). Higher soil pH; 9.0-10.10 was found only at Village Muhammad Ali Wala and Village Behak Mekan in Sargodha district.
Aquaculture professionals have reported that optimum soil pH in fish ponds is 7.5-8.0 as functioning of soil bacterial flora is maximum at this pH range (Boyd and Pippopinyo, 1994). Soil pH can also affect the activity of benthic organisms that can only survive in specific pH range in pond bottom (Cornut et al., 2012) and serve as natural food for cultured fish and shrimp (Dokulil, 2009). For soil pH <7.5, it is recommended to lime the soil to achieve optimum fish production as lower soil pH can decrease the rate of microbial decomposition of organic matter and lower the availability of phosphrous from the applied fertilizers. In present study, pH of the soil was higher than 7.5 in samples collected from different depths, it is, therefore, suggested that soil at these sites does not require lime treatment to increase soil pH (Boyd and de Queiroz, 2014; Boyd and Pippopinyo, 1994). In the tested areas where soil pH is greater than 9.0, use of acidic fertilizers is recommended to neutralize soil basicity and reduce its pH to optimum level (Boyd, 1995). Thunjai et al. (2004) measured average soil pH of 7.50 (6.62-7.90) in tilapia ponds of 3-39 years situated in Thailand. High pH was attributed to frequent use of lime in the ponds and marked the equilibrium between soil and calcium carbonate. Wudtisin and Boyd (2006) conducted a study to compare the sediment characterisics in carp, prawns and catish ponds. They reported slightly acidic sediments in most of the ponds (pH; 6-6.8) although ponds were regularly limed on annual basis. Munsiri et al. (1995) identified variation in soil pH in wet and dry form. When the pond soil is wet, its pH is determined by decomposition of iron carbonate under anaerobic conditions. pH of the acidic dry pond soil depends on aluminium content on cation exchange sites of soil and that of the basic or neutral pond soil by the dissolution of basic minerals e.g. calcium carbonate (Masuda and Boyd, 1994).
Soil Electrical Conductivity (EC): Minimum soil electrical conductivity in Lahore division was 128.78 µScm-1 (LHR-05), 117.23 µScm-1 (LHR-06) & 115.33 µScm-1 (LHR-05) while highest EC was 2650.00 µScm-1 (LHR-12), 2613.33 µScm-1 (LHR-3) and 3050.0 µScm-1 (LHR-3) at 1-3 ft. depth respectively. In Gujranwala division, soil EC ranged from 124.33 µScm-1 (GRW-15) to 928.33 µScm-1 (GRW-16), 123.47 µScm-1 (GRW-13) to 789.00 µScm-1 (GRW-16) and 130.17 µScm-1 (GRW-13) to 687.67 µScm-1 (GRW-16) in soil samples collected from three different depths. Lowest EC in Sahiwal division was found to be 761.67 µScm-1 (SW-21), 660.33 µScm-1 (SW-21) and 548.0 µScm-1 (SW-20) while highest EC was 1933.33 µScm-1 (SW-20), 1556.67 µScm-1 (SW-20) and 1024.0 µScm-1 (SW-19) at 1-3 ft. depth. In Sargodha division, minimum EC was found at SGR-31; 196.67 µScm-1 (1 ft.), 234.67 µScm-1 (2 ft.) and 239.0 µScm-1 (3 ft.). Highest soil EC was recorded at SGR-30 (14520.0 µScm-1) at 1 ft. and SGR-29 (6590.0 µScm-1 and 6529.0 µScm-1) at 2 ft. and 3 ft. depth.
Salinity of soil is determined by its electrical conductivity. According to the classification of Dellavalle (1992), soil at seven sites of Lahore division was either non-saline or very slightly saline with EC of less than 800 µScm-1. At Village Manga in Raiwind, Village Ladheki, situated in Oonche tehsil of Lahore district, Village Kala Khatai in Sheikhupura district, soil was either saline, strongly saline or very strongly saline (Table 2). In Chak 574 in Nankana Sahab district, upper soil layer was very strongly saline while deeper layers were moderately saline. High soil salinity at some of the studied sites indicates that special attention must be paid to salinity tolerance of cultured fish/ shrimp species while considering the sites for aquaculture. It can, therefore, be inferred that when a site is selected to determine its potential for aquaculture, soil quality at various depths can be investigated to locate the layer with suitable salinity. Soil at all the sites of Gujranwala division was found to be non-saline or slightly saline. Moderately saline site was present in Sahiwal division at Chak Jaffer Shah, Pakpattan district, while strongly saline nature of upper soil layer was recorded at Papli Pehar Road and Mujahid pura in okara district. Saline and very strongly saline soil was found in Sargodha division at all the sites of Sargodha and Khushab districts except in Village Hernali, Peelan tehsil situated in Mianwali district. Figure 4 shows a comparison of soil EC (at 3 ft. depth) in four divisions. Highest soil EC was found in Sargodha division where it was higher than 2500 µScm-1 in more than 50% of the soil samples and greater than 5000 µScm-1 in about 25% of the samples. Highest soil EC was found at Kandewala road in Sargodha district where it was 18173 µScm-1 at 1 ft., 4283 µScm-1 at 2 ft. depth and 5200 µScm-1 at 3 ft. depth. These results are in agreement with those of Siddiq and Raza (2011) who reported that nature of soil in 40.6% of soil samples collected from Sargodha division were affected by salt.
Correlation Analysis: Results of bivariate correlation analysis of soil quality variables have been presented in Table 3. Sand particles was negatively correlated with soil clay content; rs = -.724, silt content; rs = -.560, (P<.001), pH; rs = -.324 and electrical conductivity; rs = -.325 ((P<.01). There was significant positive correlation of clay particles with soil pH; rs = .485 and soil EC; rs =.487 (P<.001). Moreover, there was significant positive correlation between soil pH and EC; rs = .303 (P<.01). Results of strong positive correlation between soil clay content and pH & EC are in accordance with the fact that clay particles can adsorb inorganic ions due to their very large surface area of 10-800 m2g-1 (Hendricks, 2006). Buffering capacity of soil that in turn is related to cation exchange sites on clay particles is also attributed to their enormous surface area (Jabin, 2008).
Conclusion: Conclusively, most of the sites of Lahore, Sargodha and Sahiwal assessed in present study were appropriate for aquaculture. All the selected sites of Gujranwala division were found unsuitable in present form for ponds construction. Areas with high soil sand content and low level of clay particles cannot be used for ponds without adoption of suitable soil management techniques like lining with impervious materials or/and mixing of clay minerals. Soil with high clay content, if used as pond bottom and embankments, will cause engineering issues during pond construction & management and increase the operational cost of the fish farm because additional steps will be required to reduce clay turbidity in pond water. It is concluded that final recommendation on site suitability shouldn’t be derived merely from soil texture class and the actual content of soil separates must be considered during taking such decisions. In future, this type of studies should be conducted covering other areas of the province to build a database on the basis on soil quality parameters. Such type of data will aid in development of GIS based models to categorize the suitable sites for aquaculture in Punjab, Pakistan.
Table 1. Soil particle size distribution at different sites in four divisions of Punjab.
Site code
|
Sand (%)
|
Silt (%)
|
Clay (%)
|
| |
1 ft.
|
2 ft.
|
3 ft.
|
1 ft.
|
2 ft.
|
3 ft.
|
1 ft.
|
2 ft.
|
3 ft.
|
|
LHR-1
|
30.33 ± 5.86
|
30.33 ± 8.39
|
31.33 ± 8.74
|
56.67 ± 4.04
|
55.33 ±5.51
|
55.33 ± 7.02
|
13.0 ± 2.0
|
14.33 ± 3.06
|
13.33 ± 2.08
|
|
LHR-2
|
29.0 ± 1.73
|
27.33 ± 0.58
|
30.67 ± 3.51
|
50.33 ± 1.53
|
52.0 ± 1.00
|
49.00 ± 2.65
|
20.67 ± 1.15
|
20.67 ± 1.53
|
20.33 ± 1.53
|
|
LHR-3
|
14.31 ± 1.18
|
13.00 ± 1.10
|
13.65 ± 2.01
|
59.30 ± 6.09
|
56.63 ± 2.27
|
55.97 ± 1.99
|
26.39 ± 6.00
|
30.38 ± 2.01
|
30.38 ± 2.01
|
|
LHR-4
|
32.46 ± 6.95
|
35.11 ± 8.10
|
39.81 ± 7.57
|
47.29 ± 6.44
|
45.30 ± 6.44
|
45.95 ± 3.47
|
20.25 ± 1.17
|
19.59 ± 2.01
|
14.25 ± 4.16
|
|
LHR-5
|
20.87 ± 4.02
|
18.87 ± 5.92
|
21.51 ± 2.33
|
51.95 ± 2.00
|
53.95 ± 5.26
|
51.98 ± 7.22
|
27.17 ± 5.30
|
27.18 ± 7.20
|
26.52 ± 7.01
|
|
LHR-6
|
17.0 ± 5.0
|
22.33 ± 9.07
|
31.33 ± 21.39
|
65.33 ± 6.03
|
61.67 ± 1.53
|
54.67 ± 15.70
|
17.67 ± 9.29
|
16.00 ± 8.89
|
14.00 ± 6.56
|
|
LHR-7
|
18.84 ± 5.29
|
18.15 ± 5.03
|
17.51 ± 5.03
|
63.97 ± 5.29
|
68.65 ± 8.32
|
69.29 ± 8.09
|
17.19 ± 0
|
13.20 ± 3.46
|
13.19 ± 3.46
|
|
LHR-8
|
37.0 ± 4.58
|
33.67 ± 2.08
|
32.33 ± 2.08
|
47.33 ± 2.89
|
50.33 ± 0.58
|
51.00 ± 2.65
|
15.67 ± 2.08
|
16.00 ± 2.00
|
16.67 ± 1.15
|
|
LHR-9
|
24.33 ± 1.12
|
23.63 ± 0.03
|
22.98 ± 1.17
|
50.62 ± 1.14
|
49.98 ± 2.00
|
49.31 ± 1.15
|
25.05 ± 1.15
|
26.39 ± 2.00
|
27.72 ± 2.32
|
|
LHR-10
|
5.89 ± 1.77
|
5.58 ± 3.83
|
4.64 ± 0.73
|
21.6 ± 1.14
|
22.40 ± 1.27
|
23.37 ± 2.33
|
72.51 ± 2.89
|
72.02 ± 4.65
|
71.99 ± 2.97
|
|
LHR-11
|
56.67 ± 14.64
|
51.00 ± 11.53
|
49.33 ± 11.24
|
34.0 ± 11.0
|
36.0 ± 7.21
|
36.33 ± 5.51
|
9.67 ± 4.62
|
13.00 ± 4.36
|
14.33 ± 5.86
|
|
LHR-12
|
15.47 ± 4.62
|
14.80 ± 4.00
|
16.13 ± 1.15
|
54.0 ± 2.0
|
56.0 ± 4.00
|
45.33 ± 2.31
|
30.53 ± 3.06
|
29.20 ± 4.00
|
38.53 ± 3.06
|
|
GRW-13
|
93.33 ± 2.52
|
93.67 ± 2.31
|
93.33 ± 3.79
|
4.67 ± 2.52
|
5.00 ± 3.46
|
5.33 ± 2.31
|
2.0 ± 0
|
0.33 ± 0.58
|
2.33 ± 0.58
|
|
GRW-14
|
12.67 ± 9.87
|
19.33 ± 4.16
|
16.67 ± 19.41
|
50.35 ± 2.52
|
47.04 ± 6.53
|
51.36 ± 18.05
|
36.99 ± 9.66
|
33.63 ± 3.19
|
31.98 ± 10.0
|
|
GRW-15
|
78.33 ± 6.11
|
75.67 ± 3.06
|
74.33 ± 5.23
|
16.67 ± 6.11
|
19.33 ± 3.06
|
20.67 ± 1.85
|
5.0 ± 0
|
5.00 ± 0.00
|
5.00 ± 2.64
|
|
GRW-16
|
13.90 ± 1.06
|
25.43 ± 5.62
|
28.07 ± 2.87
|
37.25 ± 4.03
|
41.84 ± 2.01
|
44.26 ± 2.52
|
48.84 ± 2.99
|
32.73 ± 4.91
|
27.67 ± 2.50
|
|
GRW-17
|
35.12 ± 6.14
|
42.44 ± 6.95
|
73.10 ± 15.13
|
57.29 ± 4.18
|
50.63 ± 7.58
|
19.98 ± 13.84
|
7.60 ± 2.0
|
6.93 ± 1.15
|
6.93 ± 2.31
|
|
GRW-18
|
36.49 ± 3.44
|
42.45 ± 3.44
|
63.10 ± 25.46
|
57.25 ± 3.04
|
52.62 ± 4.14
|
31.31 ± 23.84
|
6.26 ± 1.15
|
4.93 ± 1.15
|
5.60 ± 2.00
|
|
SW-19
|
18.33 ± 3.06
|
27.67 ± 10.26
|
26.33 ± 2.31
|
64.67 ± 3.06
|
60.50 ± 5.20
|
63.33 ± 7.23
|
17.0 ± 4.0
|
12.33 ± 7.37
|
10.33 ± 4.93
|
|
SW-20
|
11.04 ± 2.02
|
8.93 ± 0.04
|
23.65 ± 1.17
|
68.15 ± 1.5
|
60.58 ± 2.28
|
52.54 ± 0.59
|
20.81 ± 2.08
|
30.49 ± 2.32
|
23.81 ± 0.58
|
|
SW-21
|
14.18 ± 5.02
|
16.16 ± 8.07
|
15.50 ± 1.15
|
66.97 ± 12.16
|
58.65 ± 15.28
|
72.64 ± 3.06
|
14.18 ± 5.02
|
16.16 ± 8.07
|
15.50 ± 1.15
|
|
SGR-22
|
45.13 ± 4.63
|
41.11 ± 6.12
|
51.11 ± 5.03
|
40.62 ± 4.18
|
44.30 ± 7.35
|
35.97 ± 5.29
|
14.25 ± 1.14
|
14.59 ± 6.09
|
12.92 ± 1.15
|
|
SGR-23
|
21.56 ± 2.07
|
21.37 ± 1.94
|
21.56 ± 2.31
|
43.80 ± 2.00
|
45.23 ± 2.31
|
47.78 ± 1.94
|
34.64 ± 2.03
|
33.40 ± 1.09
|
30.66 ± 3.53
|
|
SGR-24
|
38.08 ± 7.01
|
33.69 ± 3.51
|
33.78 ± 3.47
|
48.62 ± 5.70
|
44.52 ± 1.27
|
43.43 ± 0.38
|
13.3 ± 8.37
|
21.79 ± 3.65
|
22.79 ± 3.80
|
|
SGR-25
|
52.33 ± 7.96
|
54.25 ± 4.99
|
50.28 ± 3.03
|
25.43 ± 6.57
|
21.14 ± 7.18
|
21.88 ± 8.43
|
22.25 ± 1.50
|
24.60 ± 2.32
|
27.92 ± 5.96
|
|
SGR-26
|
6.67 ± 4.62
|
13.33 ± 8.33
|
41.33 ± 23.44
|
61.33 ± 12.22
|
57.33 ± 15.14
|
40.00 ± 20.78
|
32.0 ± 13.86
|
29.33 ± 23.09
|
18.67 ± 4.62
|
|
SGR-27
|
16.05 ± 0.68
|
15.86 ± 0.98
|
16.44 ± 1.41
|
65.18 ± 11.80
|
65.95 ± 13.05
|
67.57 ± 9.89
|
18.78 ± 12.46
|
18.19 ± 14.02
|
16.0 ± 10.58
|
|
SGR-28
|
14.04 ± 2.93
|
8.54 ± 2.95
|
12.35 ± 2.73
|
47.39 ± 11.83
|
48.44 ± 20.97
|
45.25 ± 12.86
|
38.57 ± 10.27
|
43.02 ± 18.23
|
42.40 ± 11.89
|
|
SGR-29
|
16.58 ± 4.28
|
15.34 ± 3.48
|
20.16 ± 1.49
|
37.84 ± 4.75
|
36.45 ± 15.38
|
39.00 ± 21.16
|
45.58 ± 7.39
|
48.21 ± 12.28
|
40.83 ± 22.10
|
|
SGR-30
|
39.47 ± 7.73
|
44.35 ± 8.11
|
44.34 ± 5.02
|
39.42 ± 4.03
|
39.94 ± 7.23
|
35.95 ± 2.00
|
21.11 ± 4.06
|
15.71 ± 2.31
|
19.70 ± 6.10
|
|
SGR-31
|
73.24 ± 5.30
|
69.89 ± 7.03
|
67.27 ± 9.96
|
17.98 ± 3.47
|
19.98 ± 6.00
|
22.62 ± 8.29
|
8.79 ± 2.00
|
10.12 ± 1.16
|
10.11 ± 3.05
|
Table 2. Soil chemical parameters at different sites in four divisions of Punjab.
Site code
|
pH
|
EC (µScm-1)
|
Soil class
|
|
1 ft.
|
2 ft.
|
3 ft.
|
1 ft.
|
2 ft.
|
3 ft.
|
1 ft.
|
2 ft.
|
3 ft.
|
|
LHR-1
|
8.35 ± 0.20
|
8.28 ± 0.15
|
8.37± 0.32
|
396.3 ± 27.3
|
354.0 ± 65.2
|
447.0 ± 99.83
|
Non saline
|
Non-saline
|
Very slightly saline
|
|
LHR-2
|
9.58 ± 0.09
|
9.56 ± 0.06
|
9.77 ± 0.19
|
319.0 ± 143.9
|
315.7 ± 70.6
|
256.3 ± 63.57
|
Non-saline
|
Non-saline
|
Non-saline
|
|
LHR-3
|
9.23 ± 0.30
|
9.85 ± 0.53
|
9.95 ± 0.17
|
1348.0 ± 204.4
|
2613.3 ± 189.3
|
3050.0 ± 384.32
|
Saline
|
Strongly saline
|
Strongly saline
|
|
LHR-4
|
8.26 ± 0.27
|
8.36 ± 0.14
|
8.30 ± 0.07
|
172.7 ± 17.9
|
134.9 ± 42.7
|
157.3 ± 14.50
|
Non-saline
|
Non-saline
|
Non-saline
|
|
LHR-5
|
7.96 ± 0.36
|
8.16 ± 0.34
|
8.19 ± 0.44
|
128.8 ± 31.8
|
118.2 ± 12.2
|
115.3 ± 24.47
|
Non-saline
|
Non-saline
|
Non-saline
|
|
LHR-6
|
8.02 ± 0.24
|
8.11 ± 0.25
|
8.12 ± 0.13
|
187.8 ± 105.1
|
117.2 ± 15.0
|
116.3 ± 11.63
|
Non-saline
|
Non-saline
|
Non-saline
|
|
LHR-7
|
9.60 ± 0.65
|
9.78 ± 0.36
|
9.88 ± 0.31
|
420.0 ± 256.1
|
420.0 ± 148.0
|
529.3 ± 390.31
|
Very slightly saline
|
Very slightly saline
|
Very slightly saline
|
|
LHR-8
|
7.62 ± 0.02
|
7.61 ± 0.01
|
7.61 ± 0.03
|
255.3 ± 14.2
|
252.7 ± 24.1
|
281.6 ± 29.57
|
Non-saline
|
Non-saline
|
Strongly saline
|
|
LHR-9
|
10.07 ± 0.14
|
10.03 ± 0.27
|
10.01 ± 0.39
|
1826.7 ± 571.5
|
2129.7 ± 560.5
|
2446. ± 570.03
|
Strongly saline
|
Strongly saline
|
Strongly saline
|
|
LHR-10
|
10.23 ± 0.42
|
10.22 ± 0.30
|
10.19 ± 0.28
|
1639.0 ± 180.5
|
1359.0 ± 181.3
|
635.4 ± 180.73
|
Strongly saline
|
Saline
|
Very slightly saline
|
|
LHR-11
|
9.47 ± 0.05
|
9.33 ± 0.16
|
9.40 ± 0.15
|
551.0 ± 33.0
|
579.7 ± 66.9
|
1349.0 ± 24.09
|
Very slightly saline
|
Very slightly saline
|
Saline
|
|
LHR-12
|
8.63 ± 0.64
|
9.57 ± 0.09
|
9.63 ± 0.06
|
2650.0 ± 757.8
|
996.0 ± 240.0
|
1004.0 ± 277.01
|
Strongly saline
|
Moderately saline
|
Moderately saline
|
|
GRW-13
|
8.51 ± 0.12
|
8.56 ± 0.21
|
8.46 ± 0.07
|
151.4 ± 15.1
|
123.5 ± 20.9
|
130.1 ± 41.64
|
Non-saline
|
Non-saline
|
Non-saline
|
|
GRW-14
|
8.24 ± 0.07
|
8.25 ± 0.06
|
8.28 ± 0.07
|
145.0 ± 10.0
|
165.0 ± 30.4
|
273.3 ± 63.53
|
Non-saline
|
Non-saline
|
Non-saline
|
|
GRW-15
|
7.63 ± 0.06
|
7.71 ± 0.09
|
7.62 ± 0.09
|
124.3 ± 8.0
|
155.3 ± 81.2
|
277.6 ± 141.23
|
Non-saline
|
Non-saline
|
Non-saline
|
|
GRW-16
|
9.92 ± 0.14
|
9.97 ± 0.21
|
9.99 ± 0.29
|
928.3 ± 86.3
|
789.0 ± 194.8
|
687.6 ± 116.63
|
Moderately saline
|
Very slightly saline
|
Very slightly saline
|
|
GRW-17
|
7.78 ± 0.08
|
7.93 ± 0.17
|
7.92 ± 0.23
|
145.3 ± 69.6
|
140.0 ± 5.6
|
133.0 ± 7.94
|
Non-saline
|
Non-saline
|
Non-saline
|
|
GRW-18
|
7.79 ± 0.16
|
7.84 ± 0.04
|
7.86 ± 0.06
|
198.7 ± 40.1
|
263.3 ± 64.1
|
136.0 ± 36.06
|
Non-saline
|
Non-saline
|
Non-saline
|
|
SW-19
|
7.85 ± 0.03
|
7.86 ± 0.14
|
7.80 ± 0.20
|
1051.0 ± 337.4
|
928.7 ± 269.5
|
1024.0 ± 460.16
|
Moderately saline
|
Moderately saline
|
Moderately saline
|
|
SW-20
|
8.40 ± 0.05
|
8.49 ± 0.09
|
8.40 ± 0.17
|
1933.3 ± 58.5
|
1556.7 ± 240.4
|
548.0 ± 46.57
|
Strongly saline
|
Saline
|
Very slightly saline
|
|
SW-21
|
8.45 ± 0.30
|
8.48 ± 0.31
|
8.79 ± 0.37
|
761.7 ± 79.2
|
660.3 ± 84.8
|
563.6 ± 152.32
|
Very slightly saline
|
Very slightly saline
|
Very slightly saline
|
|
SGR-22
|
7.94 ± 0.08
|
7.96 ± 0.11
|
8.10 ± 0.27
|
6280.0 ± 978.7
|
4953.3 ± 542.4
|
5090.0 ± 689.42
|
Very slightly saline
|
Very strongly saline
|
Very strongly saline
|
|
SGR-23
|
8.65 ± 0.17
|
8.65 ± 0.21
|
8.33 ± 0.81
|
2268.3 ± 2356.6
|
3523.3 ± 2132.4
|
3303.0 ±1985.98
|
Strongly saline
|
Very strongly saline
|
Very strongly saline
|
|
SGR-24
|
8.14 ± 0.46
|
8.54 ± 0.28
|
8.72 ± 0.31
|
6780.0 ± 9876.7
|
2034.3 ± 1655.2
|
2099.0 ± 1878.12
|
Very strongly saline
|
Strongly saline
|
Strongly saline
|
|
SGR-25
|
8.32 ± 0.25
|
8.38 ± 0.21
|
8.49 ± 0.19
|
1588.0 ± 827.7
|
1066.3 ± 73.4
|
1366.0 ± 888.65
|
Saline
|
Moderately saline
|
Saline
|
|
SGR-26
|
8.07 ± 0.10
|
8.07 ± 0.14
|
7.90 ± 0.35
|
3180.3 ± 3370.0
|
3504.7 ± 4275.8
|
3406.0 ± 4134.57
|
Strongly saline
|
Very strongly saline
|
Very strongly saline
|
|
SGR-27
|
8.01 ± 0.07
|
8.02 ± 0.08
|
8.01 ± 0.10
|
2987.3 ± 2569.9
|
2887.7 ± 2471.5
|
3103.0 ± 2919.20
|
Strongly saline
|
Strongly saline
|
Strongly saline
|
|
SGR-28
|
9.95 ± 0.27
|
10.04 ± 0.14
|
10.03 ± 0.18
|
1845.0 ± 541.7
|
1968.7 ± 228.3
|
2070.0 ± 366.64
|
Strongly saline
|
Strongly saline
|
Strongly saline
|
|
SGR-29
|
10.06 ± 0.09
|
9.70 ± 0.47
|
9.34 ± 0.82
|
7510.0 ± 8268.9
|
6590.0 ± 7716.3
|
6529.0 ± 7951.21
|
Very strongly saline
|
Very strongly saline
|
Very strongly saline
|
|
SGR-30
|
8.01 ± 0.29
|
8.52 ± 0.18
|
8.46 ± 0.13
|
18173.3 ± 3163.9
|
4283.3 ± 2097.9
|
5200.0 .± 2904.96
|
Very strongly saline
|
Very strongly saline
|
Very strongly saline
|
|
SGR-31
|
8.53 ± 0.08
|
8.47 ± 0.19
|
8.65 ± 0.17
|
196.7 ± 15.2
|
234.7 ± 15.3
|
239.0 ± 29.31
|
Non-saline
|
Non-saline
|
Non-saline
|
Table 3. Correlation matrix for soil quality parameters.
| |
|
Sand
|
Silt
|
Clay
|
pH
|
EC
|
|
Sand
|
Correlation coefficient (rs)
|
1.00
|
-.560**
|
-.724**
|
-.324*
|
-.325
|
|
Significance (Two tailed)
|
|
.000
|
.000
|
.002
|
.001
|
|
Silt
|
Correlation coefficient (rs)
|
|
1.00
|
.063
|
-.067
|
.057
|
|
Significance (Two tailed)
|
|
|
.549
|
.521
|
.586
|
|
Clay
|
Correlation coefficient (rs)
|
|
|
1.00
|
.485**
|
.478
|
|
Significance (Two tailed)
|
|
|
|
.000
|
.000
|
|
pH
|
Correlation coefficient (rs)
|
|
|
|
1.00
|
.303*
|
|
Significance (Two tailed)
|
|
|
|
|
.003
|
|
EC
|
Correlation coefficient (rs)
|
|
|
|
|
1.00
|
|
Significance (Two tailed)
|
|
|
|
|
.
|
rs: Spearman’s rho
**: Correlation is significant at .001 level (two tailed)
*: Correlation is significant at .01 level (two tailed)


Figure 1. Map of sampling sites in Punjab, Pakistan

Figure 2. Variation in particle size distribution in four divisions of Punjab, Pakistan

Figure 3. Prevalence of soil texture class in four divisions of Punjab, Pakistan
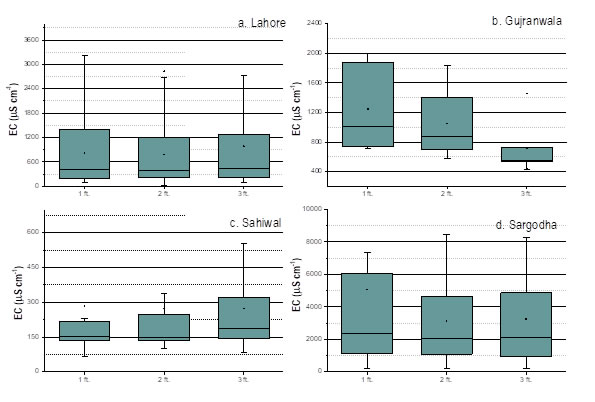
Figure 4. Variation in soil EC recorded in four divisions of Punjab, Pakistan
REFERENCES
- Ahmed, H. (2004). Soil quality analysis and considerations in the selection of sites for sustainable aquaculture in the south east coast of Chittagong specially Halishahar area. M. Sc. Thesis (unpublished), Institute of Marine Sciences and Fisheries, University of Chittagong, Chittagong, Bangladesh.
- Aloo, P., H. Charo-Karisa, J. Munguti and B. Nyonje (2017). A review on the potential of aquaculture development in Kenya for poverty alleviation and food security. African Food, Agric. Nutr. Dev. 17(1): 11832-11847.
- Bentone, J.J. (2003). Agronomic handbook : Management of crops, soils, and their fertility. CRC Press; Boca Raton, FL.
- Boyd, C.E. (1976). Chemical and textural properties of muds from different depths in ponds. Hydrobiologia. 48(2): 141-144.
- Boyd, C.E. (1995). Bottom soils, sediment, and pond aquaculture. Chapman & Hall; New York.
- Boyd, C.E. (2003). Bottom soil and water quality management in shrimp ponds. J. Appl. Aquacult. 13(1-2): 11-33.
- Boyd, C.E. and De Queiroz (2014). The role and management of bottom soils in aquaculture ponds. Infofish Int. 2.
- Boyd, C.E. and S. Pippopinyo (1994). Factors affecting respiration in dry pond bottom soils. Aquaculture, 120(3-4): 283-293.
- Boyd, C.E., M.E. Tanner, M. Madkour and K. Masuda (1994). Chemical characteristics of bottom soils from freshwater and brackishwater aquaculture ponds. J. World Aquacult. Soc. 25(4): 517-534.
- Boyd, C.E., C. Wood and T. Thunjai (2002). Aquaculture pond bottom soil quality management. Pond Dynamics/Aquaculture Collaborative Research Support Program, Oregon.
- Bunting, S.W. (2013). Principles of sustainable aquaculture : Promoting social, economic and environmental resilience. Earthscan; London.
- Cornut, J., H. Clivot, E. Chauvet, A. Elger, C. Pagnout and F. Guérold (2012). Effect of acidification on leaf litter decomposition in benthic and hyporheic zones of woodland streams. Water Res. 46(19): 6430-6444.
- Dellavalle, N.B. (1992). Handbook on reference methods for soil analysis. Soil and Plant Analysis Council; Athens, GA.
- Dokulil, M. (2009). Comparative primary production. In: Likens G.E. (ed.) Encyclopedia of Inland Waters. Vol 1. Elsvier; Oxford. page-130-137.
- Field, A.P. (2013). Discovering statistics using IBM SPSS. SAGE; London.
- Frankic, A. and C. Hershner (2003). Sustainable aquaculture: Developing the promise of aquaculture. Aquacult. Int. 11(6): 517-530.
- Hajek, B.F. and C.E. Boyd (1994). Rating soil and water information for aquaculture. Aquacult. Eng. 13(2): 115-128.
- Hendricks, D.W. (2006). Water treatment unit processes : Physical and chemical. CRC/Taylor & Francis; Boca Raton, FL.
- Jabin, M. (2008). Influence of environmental factors on the distribution pattern of centipedes (chilopoda) and other soil arthropods in temperate deciduous forests. Cuvillier Verlag; Göttingen.
- Masuda, K. and C.E. Boyd (1994). Chemistry of sediment pore water in aquaculture ponds built on clayey ultisols at Auburn, Alabama. J. World Aquacult. Soc. 25(3): 396-404.
- Mischke, C.C. (2012). Aquaculture pond fertilization : Impacts of nutrient input on production. Wiley Blackwell; Chichester, UK.
- Munsiri, P., C.E. Boyd and B.F. Hajek (1995). Physical and chemical characteristics of bottom soil profiles in ponds at Auburn, Alabama, USA and a proposed system for describing pond soil horizons. J. World Aquacult. Soc. 26(4): 346-377.
- Mustafa, A. and M.C. Undu (2017). Study on determination of categories of soil quality variable concentrations in brackish water ponds of Java island, Indonesia. Journal of FisheriesSciences.com. 11(3).
- Osman, K.T. (2013). Forest soils : Properties and management. Springer International Publishing; Cham.
- Pansu, M.G.J. (2016). Handbook of soil analysis : Mineralogical, organic and inorganic methods. Springer; New York, NY.
- Prihutomo, A. and W. Hardanu (2016). Using modified soil quality index for determining ponds bottom soil quality status of aquaculture area Bluppb Karawang West Java, Indonesia. Journal of Environment and Ecology. 7(1): 1-16.
- Siddiq, S. and A. Raza (2011). An insight into prominent soil characters of Sargodha areas for the establishment of healthy citrus orchards. J. Agric. Res.49(1).
- Siddique, M., P. Barua, and M. Ghani (2012). Comparative study of physico-chemical properties of soil according to the age of aquaculture pond of Bangladesh. Mesopotamian Journal of Marine Science. 27(1): 29-38.
- Thompson, E. (2018). Indicators of anthropogenic change and biological risk in coastal aquatic environments. Encyclopedia of the Anthropocene. 3: 97-124.
- Thunjai, T., C.E. Boyd and M. Boonyaratpalin (2004). Bottom soil quality in tilapia ponds of different age in Thailand. Aquacult. Res, 35(7): 698-705.
- Tucker, C.S., and J.A. Hargreaves (2009). Environmental best management practices for aquaculture. John Wiley & Sons; New York, NY.
- Uzukwu, P., O. George, and N. Jamabo (2011). The problem of water seepage in aquaculture: A preliminary study of the soils of arac fish farm, Omuihuechi-Aluu, Rivers State, Nigeria. Asian J. Agric. Sci. 3(2): 63-69.
- Wudtisin, I. and C.E. Boyd (2006). Physical and chemical characteristics of sediments in catfish, freshwater prawn and carp ponds in Thailand. Aquacult. Res. 37(12): 1202-1214.
- Yi, Y., C.K. Lin and J.S. Diana (2003). Techniques to mitigate clay turbidity problems in fertilized earthen fish ponds. Aquacult. Eng. 27(1): 39-51.
|


