EFFECTS OF CONCENTRATED FEEDS ON GROWTH PERFORMANCE, BLOOD PROFILES AND
CARCASS CHARACTERISTICS OF DEZHOU DONKEYS
1College of Animal Science,
Inner Mongolia Key Laboratory of Equine Genetics, Breeding and Reproduction,
Equine Research Center, Inner Mongolia Agricultural University, Hohhot 010018,
China
2College of Agronomy, Liaocheng University,
Shandong Engineering Technology Research Center for Efficient Breeding and
Ecological Feeding of Black Donkey, Shandong Donkey Industry Technology
Collaborative Innovation Center, Liaocheng 252059, Shandong Province, China
3National Engineering Research Center for
Gelatin-based Traditional Chinese Medicine, Dong-E-E-Jiao Co. Ltd., Dong-E
County 252201, Shandong Province, China
4Shandong Vocational Animal Science and
Veterinary College, East Shengli Street, Weifang 261061, China
5Faculty of Veterinary Science, University
of Agriculture, Faisalabad, Pakistan
Correspondence Author E-mail: ahrar1122@yahoo.com (AK); dmanglai@163.com (MDJ)
#These authors contributed equally to this article.
ABSTRACT
The nutritional requirements of donkeys
have not been studied well, therefore, donkeys are being fed according to the
horse nutritional plans in China. Keeping in mind the importance of the topic,
the best concentrate feed was searched among three different levels i.e., 1,
1.25 and 1.5% based on growth performance, blood profiles and carcass
characteristics. In this study, 30 male Dezhou donkeys (weight: 147.36±6.32 kg; age:210±10 days) were
randomly divided into 3 groups according to daily concentrate intake: 1.00%
(Group 1.00), 1.25% (Group 1.25) and 1.50% (Group 1.50) of live weight.
Roughage in the form of beanstalk was the only forage for all groups. On the
basis of their growth performance, blood parameters, carcass characteristics
and visceral indexes, we found that Group 1.50 and 1.25 showed higher average
body gain, body sides and carcass percentage (P≤0.05) than Group
1.00, the visceral indices and blood parameters showed no difference among 3
groups (P>0.05). Based on all the fundamental measurements, we could
draw a conclusion that concentrates at 1.25% of live weight level is the most
efficient quantity to feed Dezhou donkeys.
Keywords: Dezhou donkeys; Concentrate level; Carcass percentage;
Dressing percentage; Visceral
index.
https://doi.org/10.36899/JAPS.2020.4.0095
Published online April 25, 2020
INTRODUCTION
As
one kind of monogastric herbivorous animal, donkeys have the unique nutritional
and physiological characteristics. It’s regrettable that considered as an
important meat-producing animal in many countries, especially in China, the
research of donkey’s breeding for meat production has been overlooked for a
long time. Since nutritional needs have not received as much attention as those
of the horse. Hence, the nutritional requirements of the horse are still the
main reference for donkey breeders in China (Pearson et al. 2001). As described previously (Maloiy 1973), intake of 3.1% dry matter per unit weight for
donkeys is higher than other herbivores. According to previous reported results
(Pearson & Merritt 1991), the dry matter
intake of donkey ranged from 0.83% to 2.6% per unit weight. Some researcher
thinks the variations in dry matter percentage among different research groups could
partially be due to different breeding ways (Franco et al. 2013).
Concentrate feed intake
affects the dry matter intake and the performance of donkeys since it provides
most of the nutrition. Concentrate supplementation intake for donkeys have been
extrapolated from the horse recently (Wei et al. 2018). According to da
Silva et al. (2015), with the increase in the concentrate
levels in feedlot diets of crossbred dairy steers, the performance and physical
characteristics of the carcass changed significantly. Demand for donkey’s meat
and hides in China is increasing day by day that necessitates donkeys must be
healthy. The effects of concentrate levels on the performance of Dezhou donkeys
have not been studied. Therefore, considering the increasing interest of the
donkeys in China and the paucity of knowledge regarding the feeding practice parameters,
we investigated the optimum amount of concentrate feed of Dezhou donkeys during
the fattening stage, which may be further utilized to improve Dezhou donkey
performance.
MATERIALS AND METHODS
Experiments
were conducted from January to September, 2017 for 270 days at the Tianlong
Farm of Dong-E-E-Jiao Co. Ltd. (http://www. dongeejiao.com/). The animal
experiments were approved by the Animal Welfare Committee, Liaocheng
University, Liaocheng, Shandong, China. All the procedures were conducted in
accordance with the guidelines of Dong-E-E-Jiao Co. Ltd.
Animals and
experimental design: Thirty healthy Dezhou donkeys, at
the age of 8 months with weights of 147.36±6.32 kg, were randomly divided
into three equal treatment groups for the feeding of diet with concentrate
supplement at the level of 1.00% (Group 1.00), 1.25% (Group 1.25) and 1.50%
(Group 1.50) of live weight. After a period of adaptation (7 days), the trial
period began. Beanstalk the only form of forage was offered to all donkeys. All
donkeys were fed in individual stalls (3×4 m) with a feeder (1.0 m long), and
an automatic water dispenser was also provided. The entire feeding process was
carried out under outdoor natural lighting and conducted by a specially trained
person. The composition and nutrition levels of concentrate and roughage feed
are listed in Table 1. Five donkeys were randomly selected from each group and
fasted for 12h before slaughter at the end of the feeding process. An
electrical stunner (about 280 voltages) was used to stun the donkeys, after
that slaughtered at Dong-E-E-Jiao Co., Ltd. Shandong Province, China.
Feeding and
management: Donkeys
were fed forage at 7:00, 11:00, 17:00 and 22:00 hours while concentrate at 7:00
and 17:00 hours daily. Animals were allowed to drink water ad libitum.
Each donkey in each group was weighed every month in order to adjust the
concentrate quantity and calculate the cumulative growth and monthly weight
gain.
Growth performance
parameters: At
the end of the experiment (day 270), the number of days in the feedlot (DF
days), initial body weights (IBW), final body weights (FBW), body length (BL),
chest circumference (CC), width (CW) and depth (CD) indices were recorded
following the procedure described previously (Xiao et al. 2012a).
Hemato-biochemical
profiles: To
get the evaluation of hemato-biochemical parameters, two blood samples were obtained at the end of the
feeding experiment, from the jugular vein of each donkey, with or without
anticoagulant. The blood samples collected without anticoagulants were allowed
to clot, then the coagulant tubes were centrifuged for 10 min at 2000 rpm, and
the serum was stored at -20°C until further analysis (Majeed et al. 2018). Serum total proteins (STP), albumin
(ALB), globulin (GLB), urea (UREA), triglyceride (TG), alanine aminotransferase
(ALT), aspartate aminotransferase (AST), alkaline phosphatase (ALP),
Gamma-Glutamyl transferase (GGT), and lactic
dehydrogenase (LDH) were determined (Ijaz et
al.
2018) using commercial analytical kits (TP A045-2-2, ALB A028-2-1, GLB C153, TG
A110-2-1, UREA C013-2-1, ALT C009-3-1, AST C010-3-1, ALP A059-3-1, GGT
C017-1-1, LDH A020-2-2, Nanjing, China) according to the manufacturer’s
instructions in People's Hospital of Liaocheng, Liaocheng City, Shandong
province, China.
The
blood samples collected with anticoagulant were subjected for hematological
analysis (Yang et al.
2019). The whole blood red
blood cell (RBC), hematocrit (HCT), white blood cell (WBC), lymphocyte (LYMPH),
monocyte (MONO), Eosinophils (EO) and neutrophilic granulocyte (NEUT) were determined
use
intelligent automatic blood cell analyzer (Beckman coulter, LH750). Hemoglobin
(HB) was detected (Tharwat et al.
2018) using commercial
analytical kits (A102-1-1, Nanjing,
China).
Carcass
characteristics and visceral indices: At the end of the
experiment, 5 random donkeys were slaughtered in each group. The dressing
quantity, abdominal fat, visceral adipose area, muscles, and bones were
weighed. Meanwhile,
the heart, liver, spleen, lungs, kidneys, pancreas, stomach and intestines were
weighed to test visceral index. Calculation formulas were followed as described
previously (Fitzsimons et al. 2014):
Carcass
percentage (CP) = Carcass quantity ÷
living weight before slaughter×100
Net
meat percentage (NMP) = Net meat quantity of carcass ÷ living weight before
slaughter×100
Bone
weight percentage (BWP) = Bone quantity ÷ living weight before slaughter×100
Dressing
percentage (DP) = Dressing quantity ÷
living weight before slaughter×100
Net
dressing and meat percentage = Net dressing and meat quantity ÷ carcass
quantity×100
Visceral
index = Visceral quantity ÷ living weight before slaughter×100
Eye muscle area (EMA): the area of Longissimus Thoracis corresponding to the
17th and 18th ribs, measured with sulfate paper and surface
area calculated.
Statistical
analysis: Data
were analyzed by one-way analysis of variance (ANOVA). The SPSS Statistics 19
(IBM, USA) and LDS (Least-significant Difference) were used to compare the mean
of each index, as mean±SEM from 5 or 10 donkeys, and each index of the
individual was conducted in triplicate. To know the growth pattern (body weight),
and time x treatment effect of the different levels of concentrate feed
analysis was carried out by repeated measure analysis. The differences of
the mean were considered having a significance level of P≤0.05 and a high
significance level of P≤0.01.
RESULTS
Growth performance: Parametric
estimates and statistical analysis performed on the growth performances are
listed in Table 2. There was no difference in IBW and CD among all Groups. FBW
and CW were significantly higher in Groups
1.50 and 1.25 than Group 1.00 (P≤0.01). The ABG, BL, and CC in
Group 1.25 were higher than Group 1.00 (P≤0.05), however, growth performance indices did not differ
between Groups 1.50 and 1.25 (P>0.05).
As can be seen
from Fig.1, body cumulative growth increased significantly (P≤0.01).
with the extended time period. The weight changes of the 3 groups were
consistent, and the weight of the 1.5 and 1.25 groups was significantly higher
than that of the 1.0 group from the fourth month of the experiment. As shown in
Fig. 2, the daily weight gain of Group 1.5 and Group 1.25 were significantly (P≤0.01)
higher than Group 1.0 in the second and third month of the experiment. The
daily body weight gain of Groups 1.5 and 1.25 had a rapid decline from fourth
month of the experiment but was relatively stable in Group 1.0 (Fig. 2).
Blood indexes: We found no
difference in biochemical parameters in all treatments (Table 3). The indices of STP, ALB, GLB, and HB were the highest in Group 1.25, these indices are closely related to the growth performance of donkeys
(Table 2). In other words, these results explain that this group had the best growth
performance in this experiment. Triglyceride and BUN did not vary
among groups. Among blood metabolic enzymes there were no significant
differences in AST, ALT, ALP and LDH values among all groups (P>0.05), but the GGT was significantly (P≤0.05) higher in Group 1.50 than 1.00 (Table 4).
As shown in Table 5, there was no
significant difference between most blood cells indices in all group of the
Dezhou donkey with the increase of feed amount of concentrate, except monocytes
those were higher in Group 1.25 than Group 1.00 (P≤0.01) and Group
1.50 (P≤0.05) while there was no difference on Group 1.50 and 1.00.
Carcass characteristics: CP and NMP are important indices to measure animal growth
performance and slaughter performance. We found that
CP was higher in Group 1.50 than Group 1.0 and Group 1.25, reaching a mean value of 61.04+1.94. We found no differences in NMP, BMP and
EMA (Table 6), but the EMA and NMP were higher and BWP was lower in Group 1.50. This demonstrates that feed quantity at 1% has limited growth. BWP was
high when donkeys were short of feed. AFP and DMP (P≤0.01) were significantly (P≤0.01) different between Group 1.50 and other Groups, with the lowest values for DP
(Table 6). With the highest feed quantity, there was much fat deposition, and
the fats gathered in the belly. The bone growth was almost stereotyped after 7
to 8 months of age, then the body weight increase was mainly dominated by fat
and muscle deposition.
Visceral indices: Parametric estimates
and statistical analysis performed on the visceral indices exhibited non-
significant difference between all groups (Table 7), suggesting that the
development of these organs in donkeys was almost stereotyped after 7 to 8
months, and then grew coordinated with the growth of the whole body, which may
be the instinctive coordination of the overall development of animals and organ
development.
Results of visceral adipose are presented
in Table 8. Visceral fat deposits were first deposited around the kidneys and
then around the liver. The kidneys fat significantly (P≤0.01)
increased in Group 1.50 with the increase of amount of supplementary feed,
while the liver fat 1.25% was significantly higher than the other two groups (P≤0.01). The pericardial fat and
peri-pulmonary fat indices also increased in Group 1.25, but the difference was
not significant.
Table 1. Concentrate
composition and nutritional components of the concentrate and roughage (air dry
basis).
Composition |
Nutrition components |
Feed nutrition levels |
Concentrate |
% |
Concentrate feed |
Beanstalk |
Corn |
54.00 |
Dry matter (%) |
88.40 |
91.04 |
Soybean
meal |
25.00 |
Digestible
Energy (MJ·kg-1) |
13.19 |
- |
Wheat
bran |
15.00 |
Crude
Protein (%) |
18.54 |
5.94 |
Soya-bean oil |
1.00 |
Neutral detergent fiber (%) |
13.98 |
69.48 |
Salt |
0.50 |
Acid detergent fiber (%) |
3.21 |
47.92 |
Lys |
0.50 |
Ether extract (%) |
1.63 |
- |
Premix |
4.00 |
Calcium
(%) |
0.86 |
- |
|
|
Total phosphorus (%) |
0.75 |
- |
Total |
100 |
Lysine
(%) |
1.20 |
- |
Note: Premix provides quantity/kg: VA 20 000IU, VD 3 500IU, VE 50mg, VK 2.5mg, VB1 2.5mg, VB2 8.0mg, VB3 25mg, VB5 32mg, VB6 0.5mg, VB9 0.5mg, Cu
30mg, Fe 200mg, Mn 50mg, Zn 220mg, Se 0.45mg, I 2.0 mg, VB12 50μg, VH
90μg. The nutritional content is measured except Lys and DE (Calculate according
to feed database).
Table
2. Effect
of concentrate feed levels on the growth performances of Dezhou donkeys.
Parameters |
Units |
Concentrate feed level (%) |
P Value |
1.00 |
1.25 |
1.50 |
Initial
body weights (IBW) |
Kg |
147.1±9.4 |
147.6±6.9 |
148.0±7.1 |
0.531 |
Final
body weight (FBW) |
Kg |
207.6±4.3B |
232.8±1.4A |
230.4±1.4A |
0.001 |
Average
body gain (ABG) |
Kg |
60.5±11.1b |
85.2±7.5a |
82.4±6.3a |
0.022 |
Body
length (BL) |
Cm |
127.4±3.0b |
132.8±0.8a |
136.3±1.2a |
0.013 |
Chest
circumference (CC) |
Cm |
128.1±2.6b |
138.8±1.3a |
134.6±1.1a |
0.001 |
Chest
width (CW) |
Cm |
25.3±1.3B |
32.4±1.1A |
30.2±0.4A |
0.001 |
Chest
depth (CD) |
Cm |
52.6±0.8 |
53.4±1.2 |
52.0±0.4 |
0.432 |
Values
(mean+SEM) with different
capital letters in a row indicate significant difference at P≤0.01, while
small letters indicate significant difference at P≤0.05. Compare capital letters first, then
the small ones.
Table
3. Effect
of concentrate feed levels on the blood biochemical parameters (mean+SEM) of Dezhou donkeys.
Parameters |
Units |
Concentrate feed level (%) |
P Value |
1.00 |
1.25 |
1.50 |
Serum
Total protein (STP) |
g·L-1 |
69.54±1.84 |
73.64±0.93 |
71.94±1.83 |
0.228 |
Albumin
(ALB) |
g·L-1 |
29.26±0.66 |
29.86±1.24 |
29.00±0.39 |
0.766 |
Globulin
(GLB) |
g·L-1 |
40.28±1.70 |
43.78±1.11 |
42.94±1.59 |
0.261 |
Triglyceride |
mmol·L-1 |
0.42±0.16 |
0.25±0.02 |
0.62±0.08 |
0.066 |
Blood
Urea Nitrogen (BUN) |
mmol·L-1 |
5.77±0.15 |
5.89±0.37 |
6.28±0.22 |
0.380 |
Table
4. Effect
of concentrate feed levels on the blood metabolic enzymes of Dezhou donkeys.
Parameters |
Concentrate feed level (%) |
P Value |
1.00 |
1.25 |
1.50 |
Alanine
aminotransferase (ALT) |
15.88±1.79 |
17.26±3.65 |
17.34±3.81 |
0.937 |
Aspartate
Aminotransferase (AST) |
413.10±41.78 |
388.96±29.32 |
430.82±17.56 |
0.645 |
Alkaline phosphatase (ALP) |
211.60±10.41 |
242.20±22.05 |
255.20±10.53 |
0.162 |
Gamma-Glutamyl transferase
(GGT) |
25.40±3.26b |
29.80±14.61ab |
55.20±4.81a |
0.040 |
Lactic
dehydrogenase (LDH) |
393.40±69.19 |
479.60±21.64 |
680.40+61.69 |
0.330 |
Values
(mean+SEM) bearing small letters in the row differ significantly (P≤0.05). Units are in
IU·L-1
DISCUSSION
In support of our
hypothesis, we found that concentrate feeding levels affect the growth
performances of donkeys as also reported in dairy
bulls (Huuskonen et al. 2014). The donkeys with
similar IBW at the start of the experiment, however, at the end of the
experiment, the FBW and ABG were significantly higher in Groups 1.50 and 1.25
than Group 1.00, and there was no difference between Group 1.50 and Group 1.25.
According to Saastamoinen (1990), first year is the period for optimum
development in body size and weight of foals that has also been observed in the
present experiment (Fig. 1). It is documented that first three years are the
key period for the development of body weight in donkeys (Xiao et al.
2012b). The significant increase in FBW of Groups 1.50 and 1.25 indicated that
these diets satisfied the growth requirements. This conformed to the literature
about the IBW that was determined by the level of concentrate in the diet (Pinto et al. 2015). As is obvious from Fig. 2, the daily weight gains of Group 1.5 and
Group 1.25 were significant (P≤0.01) higher than Group 1.0 at the
second and third month of experiment, but there was no difference between this
two groups, this could be the breed different, however, the adult daily body
weight gain and fat contents for different donkey breeds differ significantly (Martin-Rosset & Jean-Louis 2015). In the
present experiment, all of the body sizes don’t conform to already reported
equation about live weight and body sizes of the donkey (Pearson & Ouassat 1996). This difference might be since the animal’s growth curve is affected
by their breed, performance, nutrition, management, and so on (Pinto et al. 2015). According to a
published report, maintenance demand of protein for the donkey is 120 g/d per
100kg body weight (Pearson et al. 2001). Donkeys are
sensitive to energy, and when the energy demand is met, the demand for protein
can be reduced (Wood et al. 2007). Therefore, the nutrition of
donkeys must also be studied in terms of energy and protein requirements.
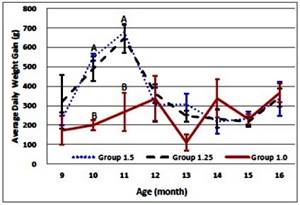
Fig. 1. The cumulative (body
weight) growth of Dezhou donkey
fed different levels of concentrate feed. Line graph (mean+SEM) bearing different capital
letters from the other line graph differ significantly (P≤0.01).
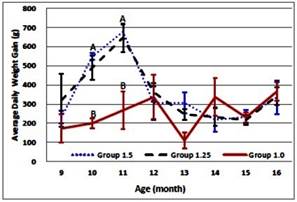
Fig. 2. The relative growth (body
weight gain) of
Dezhou donkey fed different levels of concentrate feed. Line graph (mean+SEM) bearing different capital
letters from the other line graph differ significantly (P≤0.01).
Table 5. Effect
of concentrate feed levels on the hematological values in Dezhou donkeys.
Parameters |
Units |
Concentrate feed level
(%) |
P Value |
1.00 |
1.25 |
1.50 |
Red blood cells (RBC) |
1012/L |
6.58±0.33 |
6.95±0.45 |
8.67±5.06 |
0.640 |
Hemoglobin (HB) |
g·L-1 |
114±8.60 |
116±8.40 |
155±91.27 |
0.660 |
Hematocrit (HCT) |
% |
33.14±2.32 |
33.75±3.15 |
32.96±1.69 |
0.190 |
White blood cells (WBC) |
109/L |
13.77±3.59 |
16.87±2.26 |
12.27±1.52 |
0.170 |
Neutrophils (NEUT) |
109/L |
6.93±2.56 |
7.73±2.27 |
5.11±2.80 |
0.590 |
Lymphocytes (LYMPH) |
109/L |
2.71±1.54 |
3.57±1.80 |
4.67±1.39 |
0.290 |
Monocytes (MONO) |
109/L |
0.81±0.22b |
5.97±2.56a |
1.93±2.56b |
0.030 |
Eosinophils (EO) |
109/L |
0.09±0.09 |
0.23±0.18 |
7.75±5.27 |
0.490 |
Values (mean+SEM) with different letters in a row indicate significant
differences at P≤0.05.
Table 6. Effect of concentrate feed levels on the carcass traits of Dezhou donkeys.
Parameters |
Units |
Concentrate feed level
(%) |
P Value |
1.00 |
1.25 |
1.50 |
Carcass percentage (CP) |
% |
55.25±0.33 |
56.38±1.04 |
61.04±1.94 |
0.591 |
Net meat percentage (NMP) |
% |
33.27±0.51 |
33.62±1.21 |
37.98±3.41 |
0.193 |
Bone weight percentage (BWP) |
% |
16.6±1.05 |
15.63±0.58 |
13.59±1.20 |
0.077 |
Dressing percentage (DP) |
% |
8.81±0.12A |
8.91±0.25A |
7.30±0.58B |
0.008 |
Abdominal fat percentage (ABP) |
% |
0.89±0.27B |
1.27±0.35B |
2.96+0.55A |
0.003 |
Dressing and meat percentage (AFP) |
% |
42.08±0.56B |
42.53±1.01B |
2.96±0.55A |
0.003 |
Eye muscle area (EMA) |
cm2 |
77.75±8.44 |
78.61±7.52 |
78.09±5.29 |
0.732 |
Values (mean+SEM) with different letters in a row indicate significant
differences at P≤0.05.
Table 7. Effect
of concentrate feed levels on the visceral indices (% of body weight) of Dezhou donkeys.
Organs |
Concentrate feed level
(%) |
P Value |
1.00 |
1.25 |
1.50 |
Heart |
0.56±0.01 |
0.51±0.00 |
0.54±0.01 |
0.180 |
Liver |
1.14±0.06 |
1.17±0.02 |
1.17±0.07 |
0.850 |
Lungs |
1.30±0.29 |
1.08±0.19 |
0.80±0.05 |
0.155 |
Kidneys |
0.26±0.01 |
0.26±0.01 |
0.29±0.01 |
0.085 |
Stomach |
0.34±0.03 |
0.33±0.01 |
0.36+0.00 |
0.581 |
Intestines |
3.76±0.20 |
3.67±0.40 |
3.95+0.28 |
0.765 |
Table
8. Effect of concentrate feed levels on the visceral adipose area (%) indices of Dezhou donkeys.
Parameters |
Concentrate feed level (%) |
P Value |
1.00 |
1.25 |
1.50 |
Pericardial
fat |
16.48±5.85 |
26.70±4.51 |
12.47±2.06 |
0.187 |
Perihepatic
fat |
0.52±0.23c |
4.69±0.76a |
2.48±0.79b |
0.001 |
Peripulmonary
fat |
3.50±0.74 |
8.40±2.57 |
5.17±1.58 |
0.132 |
Perirenal
fat |
86.34±7.84B |
162.44±45.71B |
319.31±36.02A |
0.001 |
Values
(mean+SEM) with different
capital letters in a row indicate significant difference at P≤0.01, while
small letters indicate significant difference at P≤0.05.
Serum total proteins and albumin reflect the nutrition
level of protein in the diet and the degree of digestion and absorption of
protein in animals to some extent (Veronesi et al. 2014; Quartuccio et al. 2015). It is documented
that hematological and serum biochemical parameters of working donkeys were
significantly affected (P≤0.05) by age (Lemma
and Moges 2009). The TG
is a direct indicator of fat digestion and absorption, and low BUN indicates a high protein utilization (Kojouri & Sharifi
2013).
In our experiment, we found no difference in blood parameters in all treatment
groups, but all of the blood indexes were within the normal range (Mori et
al. 2004). Previous studies
carried out on newborn
donkeys were found that
high nutrition levels can
significantly increase hematologic and biochemical parameters (Veronesi et al. 2014). It is thought
that plasma TG levels are usually higher in donkeys compared with horses (Zinkl et al. 1990). The indices of STP,
ALB, and GLB were the highest in Group 1.25, these indices are closely related
to the growth performance of donkeys (Sarriés & Beriain 2005). In other words, these results explain that this group
had the best
growth performance in the present study.
The
changes in serum metabolic enzymes reflect the changes in the body's metabolic
function. There were non-significant differences in AST, ALT, ALP and LDH
values among all groups, but these values
all tended to improve along with concentrate increase in the present study. It
is generally believed that the activity of AST and ALT in serum is positively
correlated with the daily weight gain of animals, thus high activity indicates
strong growth promoting effect (Meira et al. 2009). The activity of AST
and ALT increased at first and then decreased with the increase of protein
level, and finally increased again, with activity the highest when the protein
level was 26% (Keser & Bilal, 2008). This phenomenon might be due to some
damage to the liver (Wu et al. 2013). ALP is one of the important
indices of the growth performance regulating the metabolism of proteins, fat,
and carbohydrate with kinase (Xie et al. 2017). Similarly, it has been
reported previously that the increase in ALP activity is beneficial in
increasing the growth rate of animals (Adamu et al. 2013). GGT was
higher in Group 1.50 and Group 1.00, perhaps because of donkeys do not have
gallbladders and have developed fatty livers after being fed high concentrate
for a long time (Perry et al. 1998). Blood cells and blood routine indicators often together
reflect the effects of nutritional factors on the body (Divers et al.
2006) and body health (Sampaio et al. 2018). Hematological
values of donkeys are largely influenced by age, sex, physical factors of the
environment and physical activity (Zakari et al. 2016).
The
CP and NMP are important indices to measure animal growth performance and
slaughter performance. Many studies have shown a close relationship between
dietary nutrition and animal slaughter performance (Asaniyan
2014). It has been reported that the slaughter rate of lambs increases
with the increase of live weight before slaughter (Simeonov et al. 2014).
We found that CP was higher in Group 1.50 than Group 1.0 (P≤0.01) and Group 1.25 (P≤0.05),
reaching a mean value of 61.04%. This CP level in the present study was higher
than 52.5%, 53.9% and 59.3% previous reported (Lanza et al. 2009; Franco et al. 2013; Polidori et al. 2015). The difference
could be due to
breed,
age at slaughter and
feed nutrition, etc.
The
NMP, BWP, and EMA were similar among the three groups, but the EMA and NMP were
higher in Group 1.50, whereas, BWP was lower. Similar to our results, Vaz et
al. (2002) verified that cross-bred cattle did not change the NMP, BWP, and
EMA with the improvement in concentrate level. It was reported previously that the
increasing concentrate level increased carcass gain and dressing proportion of
the bulls but had no effects on carcass conformation or fat score (Huuskonen et al. 2014).
In our study, he AFP and DMP (P≤0.01) in Group 1.50 were
significantly higher than other groups, and the DP resulted in the opposite
with the other groups (P≤0.01). With the highest feed quantity,
there was much fat deposition, and the fats gathered in the belly (Rotta et al. 2009).
The bone growth was almost stereotyped after 7 to 8 months of age afterward
body weight increase was mainly dominated by fat and muscle deposition. BWP was high when donkeys were short of feed. This
demonstrates that feed quantity at 1% limited growth perhaps.
The
quantity and organ index of visceral reflect the functional status of the
animal body to a certain extent, which is of great significance for theoretical
research and production practice. It has been pointed out that the visceral organ indices can be
used as an approximate index of its function, which often reflects the
nutritional status of animals and the physiological state of the viscera (Humphrey
& Kumaratilake 2017). In the present
study, there was no significant difference in visceral indices between all
groups, suggesting that the development of these organs in donkeys was almost
stereotyped up to 7 to 8 months, and then grew coordinated with the growth of
the whole body, which may be the instinctive coordination of the overall
development of animals and organ development. This is consistent with that
reported previously that concentrate levels have no significant influence on
the viscera index (Zhao et al. 2014).
Excessive
nutrition intake of animals leads to fat deposition, the fat deposition
sequence and parts differing in different animals. In donkeys when fat
deposition starts, it first deposits around the kidneys and then around the
liver, thus more fat deposition
will the improve energetic level of the diet (Alexandra et al. 2011).
Thus, with the increase of the amount of supplementary feed in the present
study, the kidney fat significantly increased (P≤0.01), and the
liver fat in 1.25 group was significantly higher than in the other two groups (P≤0.05).
Conclusions: We concluded that
while feeding to Dezhou
donkeys, as
the amount of concentrate feed increased, the growth performance, carcass
characteristic and carcass traits improved to a certain extent, specifically in
Group 1.50. The higher growth performance and carcass characteristic were
obtained in 1.25 and 1.50 concentrate feed levels. Combining input-output ratio
and lean meat, 1.25% concentrate supplement was found to be the best choice.
Acknowledgments: Donkey
innovation team of Shandong modern agricultural industry technology system (SDAIT-27)
provided the funds of experimental animals, Shandong University Science and
Technology project (J16LF10) provided the expenditure of results analysis. This
work was also technically supported by Liaocheng University Donkey
Collaborative Innovation Centre of Industrial System for efficient breeding and
ecological feeding. This work was also supported by Chinese National Natural Science
Foundation (31860636) and Inner Mongolia Agricultural University Grant (NDYB2016-01
and QN201905).
REFERENCES
- Adamu, L., M.A. Noraniza, A. Rasedee and A. Bashir (2013). Effect of age and performance on physical, hematological, and biochemical parameters in endurance horses. J. Equine Vet. Sci. 33: 415-420.
- Alexandra, S., T.T. Nihal, G. Yongxin, C. Kit-Yan and P.J. Scarpace (2011). Prevention and reversal of diet-induced leptin resistance with a sugar-free diet despite high fat content. Brit. J. Nutr. 106: 390-397.
- Asaniyan, E.K. (2004). Growth performance, feed intake and slaughter characteristics of broiler chicken under three different stocking densities. J. Anim. Prod. Adv. 4: 348-354.
- da Silva, G.S., A.S.C. Veras, M.D. Ferreira, W.M. Dutra, M.L.M.W. Neves, E.J.O. Souza, F.F.R. de Carvalho and D.M. de Lima (2015). Performance and carcass yield of crossbred dairy steers fed diets with different levels of concentrate. Trop. Anim. Health Prod. 47: 1307-1312.
- Divers, T.J., J.E. Cummings, A. de Lahunta, H.F. Hintz and H.O. Mohammed (2006). Evaluation of the risk of motor neuron disease in horses fed a diet low in vitamin E and high in copper and iron. Am. J. Vet. Res. 67: 120-126.
- Fitzsimons, C., D.A. Kenny and M. Mcgee (2014). Visceral organ weights, digestion and carcass characteristics of beef bulls differing in residual feed intake offered a high concentrate diet. Animal. 8: 949-959.
- Franco, D., S. Crecente, J.A. Vázquez, M. Gómez and J.M. Lorenzo (2013). Effect of cross breeding and amount of finishing diet on growth parameters, carcass and meat composition of foals slaughtered at 15 months of age. Meat Sci. 93: 547-556.
- Humphrey, C. and J. Kumaratilake (2017). A histological analysis of visceral organs to evaluate the effect of duration of heating from refrigeration to core body temperature for ballistics investigations. Am. J. Forensic. Med. Pathol. 7: 1-7.
- Huuskonen, A., M. Pesonen and E. Joki-Tokola (2014). Effects of supplementary concentrate level and separate or total mixed ration feeding on performance of growing dairy bulls. Agri. Food Sci. 23: 257-265.
- Ijaz, M., M.A. Zaman, F. Mariam, S.H. Farooqi, A.I. Aqib, S. Saleem, A. Ghaffar, A. Ali and R. Akhtar (2018). Prevalence, hematology and chemotherapy of gastrointestinal helminths in camels. Pak. Vet. J. 38: 81-85.
- Keser, O. and T. Bilal (2008). Effect of different dietary crude protein levels on performance, n digestibility and some blood parameters in Kivircik lambs. Acta Vet. 58: 487-498.
- Kojouri, G.A. and S. Sharifi (2013). Preventing effects of nano-selenium particles on serum concentration of blood urea nitrogen, creatinine, and total protein during intense exercise in donkey. J. Equine Vet. Sci. 33: 597-600.
- Lanza, M., C. Landi, M. Scerra, V. Galofaro and P. Pennisi (2009). Meat quality and intramuscular fatty acid composition of Sanfratellano and Haflinger foals. Meat Sci. 81: 142-147.
- Lemma, A. and M. Moges (2009). Clinical, hematological and serum biochemical reference values of working donkeys (Equus asinus) owned by transport operators in Addis Ababa, Ethiopia. Livest. Res. Rural Develop. 21: 1-7.
- Majeed, W., T. Khaliq, B. Aslam and J.A. Khan (2018). Polyherbal formulation prevents hyperglycemia by modulating the biochemical parameters and upregulating the insulin signaling cascade in alloxan induced hyperglycemic rats. Pak. Vet. J. 38: 121-126.
- Maloiy, G.M.O. (1973). The effect of dehydration and heat stress on intake and digestion of food in the Somali donkey. Environ. Physiol. Biochem. 3: 36-39.
- Martin-Rosset, W. and T. Jean-Louis (2015). Chapter 8. Ponies, donkeys and other cases of interest. In: Equine Nutrition; Martin-Rosset, W. (ed). Wageningen Academic Publishers; Wageningen Academic Publishers, Wageningen, The Netherlands; pp: 278-311.
- Meira, J.E.B., H. Rizzo, F.J. Benesi and L. Gregory (2009). Influence of age and sex on total serum protein and albumin and aspartato-aminotransferase and gama-glutamiltransferase serum activities on Santa Inês sheep. Braz. J. Vet. Res. Anim. Sci. 46: 448-454.
- Mori, E., R.M.S. Mirandola, R.R. Ferreira, J.V. Oliveira, F. Gacek and W.R. Fernandes (2004). Reference values on hematologic parameters of the Brazilian donkey (Equus asinus) breed. J. Equine Vet. Sci. 24: 271-276.
- Pearson, R.A. and J.B. Merritt (1991). Intake, digestion and gastrointestinal transit time in resting donkeys and ponies and exercised donkeys given ad libitum hay and straw diets. Equine Vet. J. 23: 339-343.
- Pearson, R.A. and M. Ouassat (1996). Estimation of the liveweight and body condition of working donkeys in Morocco.Vet. Record. 138: 229-233.
- Pearson, R.A., R.F. Archibald and R.H. Muirhead (2001). The effect of forage quality and level of feeding on digestibility and gastrointestinal transit time of oat straw and alfalfa given to ponies and donkeys. Brit. J. Nutr. 85: 599-606.
- Perry, I.J., S.G. Wannamethee and A.G. Shaper (1998). Prospective study of serum gamma-glutamyltransferase and risk of NIDDM. Diabetes Care. 21: 732-735.
- Pinto, A., R.A.C. Passetti, A. Guerrero, D.C. Rivaroli, D. Perotto and I.N. do Prado (2015). Concentrate levels of crossbred bulls slaughtered at 16 or 22 months: performance and carcass characteristics. Acta Sci. Anim. Sci. 37: 149-157.
- Polidori, P., S. Pucciarelli, A. Ariani, V. Polzonetti and S. Vincenzetti (2015). A comparison of the carcass and meat quality of Martina franca donkey foals aged 8 or 12 months. Meat Sci. 106: 6-10.
- Quartuccio, M., F. Arfuso, C. Giannetto, E. Giudice, S.D. Pietro and G. Piccione (2015). Serum total proteins and related electrophoretic fractions in growing foals. Arch. Anim. Breed. 58: 123–126.
- Rotta, P.P., R.M. do Prado, I.N. do Prado, M.V. Valero, J.V. Visentainer andR.R. Silva (2009). The effects of genetic groups, nutrition, finishing systems and gender of Brazilian cattle on carcass characteristics and beef composition and appearance: a review. Asian-Australas. J. Anim. Sci. 22: 1718-1734.
- Saastamoinen, M.T. (1990). Heritabilities for body size and growth rate and phenotypic correlations among measurements in young horses. Acta Agri. Scandinavica 40: 377-386.
- Sampaio, N.G., S.J. Emery, A.L. Garnham, Q.Y. Tan, X. Sisquella, M.A. Pimentel, A.R. Jex, N. Regev-Rudzki, L. Schofield and E.M. Eriksson (2018). Extracellular vesicles from early stage Plasmodium falciparum-infected red blood cells contain PfEMP1 and induce transcriptional changes in human monocytes. Cell. Microbiol. 20: e12822.
- Sarriés, M.V. and M.J. Beriain (2005). Carcass characteristics and meat quality of male and female foals. Meat Sci.70: 141-152.
- Simeonov, M., N. Todorov, K. Nedelkov, A. Kirilov and D.L. Harmon (2014). Influence of live weight, sex and type of birth on growth and slaughter characteristics in early weaned lambs. Small Rumin. Res. 121: 188-192.
- Tharwat, M., M. Sadan, E. El-Shafaey, A.A. Al-Hawas and E. Saeed (2018). Unilateral nephrectomy in a female dromedary camel with pyelonephritis caused by Staphylococcus lugdunensis. Pak. Vet. J. 38: 116-118.
- Vaz, F.N., J. Restle, P.S. Pacheco, A.K. de Freitas, L.A.O. Peixoto andC.O. Carrilho (2002). Carcass and meat characteristics of young steers of three genetic groups, produced by two years old females. Rev. Brasil de Zootec. 31: 1973-1982.
- Veronesi, M.C., A. Gloria, S. Panzani, M.P. Sfirro, A. Carluccio and A. Contri (2014). Blood analysis in newborn donkeys: hematology, biochemistry, and blood gases analysis. Theriogenology. 82: 294-303.
- Wei, Z.X., Y.Q. Chen, H.L. Qu, Y.G. Chen, Y.L. Feng and W.Q. Li (2018). Research progress of nutrient requirements of donkeys. J. Liaocheng Univ. 31: 106-110 (in Chinese).
- Wood, S.J., D.G. Smith and C.J. Morris (2007). Seasonal variation of digestible energy requirements of mature donkeys in the UK. Pferdeheilkunde. 21: 39-40.
- Wu, L., W. Wang, K. Yao, T. Zhou, J. Yin, T. Li, L. Yang, L. He, X. Yang, H. Zhang, Q. Wang, R. Huang and Y. Yin (2013). Effects of dietary arginine and glutamine on alleviating the impairment induced by deoxynivalenol stress and immune relevant cytokines in growing pigs. Plos One. 8: e69502.
- Xiao, H.X., T. Aji-De, G.Q. Shi, S.J. Yu, P.S. Shi and J. Rexidan (2012a). The correlation and regression analysis of weight and size traits in Jiangyue donkey. China Dairy Cattle (in Chinese) 23: 27-31.
- Xiao, H.X., T. Aji-De, G.Q. Shi, S.J. Yu, X.D. Re and P.S. Shi (2012b). Correlation analysis between body weight and body size of Hetian Qing donkey by R project. Acta Agri. Univ. Jiangxiensis. 34: 762-768.
- Xie, C., Y. Li, J. Li, L. Zhang, G. Zhou and F. Gao (2017). Dietary starch types affect liver nutrient metabolism of finishing pigs.Brit. J. Nutr. 118: 353-359.
- Yang, L., K. He, J. Li, Y. Ma, R. Li, M. Hou, Y. Gao and J. Zhong (2019). Correlation of antibody levels with peripheral lymphocyte subsets and routine hematological parameters after vaccination with FMD vaccine in young sires. Pak. Vet. J. 39: 251-255.
- Zakari, F.O., J.O. Ayo, P.I. Rekwot and M.U. Kawu (2016). Effect of age, sex, physical activity and meteorological factors on haematological parameters of donkeys (Equus asinus). Comp. Clin. Pathol. 25: 1265-1272.
- Zhao, Y.G., Q.H. Hong, P. Xie, Q.Q. Hu, S.N. Liu and R. Hong (2014). Effects of diet nutritional on slaughter performances and meat quality of Yunnan semi-wool sheep. Acta Prataculturae Sinica (in Chinese) 23 (2): 277-286.
- Zinkl, J.G., D. Mae, P.G. Merida, T.B. Farver and J.A. Humble (1990) Reference ranges and the influence of age and sex on hematologic and serum biochemical values in donkeys (Equus asinus). Am. J. Vet. Res. 51: 408-413.
|


