The Journal of Animal & Plant Sciences, 30(1): 2020, Page: 212-218
ISSN: 1018-7081
INFLUENCE OF MOZZARELLA AND CHEDDAR CHEESE BLENDING ON BAKING PERFORMANCE, VISCOSITY AND MICROSTRUCTURE OF PIZZA CHEESE BLENDS
N. Gulzar1*, A. Sameen2, S. Rafiq3, N. Huma2 and M. S. Murtaza4
1Department of Dairy Technology, University of Veterinary and Animal Sciences, Lahore
2 National Institute of Food Science and Technology, University of Agriculture Faisalabad, Pakistan
3 Department of Food Science and Technology, University of Poonch, Rawalakot
4Department of Food Science and Technology, MNSUA Multan
*Corresponding author’s email: nabila.gulzar@uvas.edu.pk
ABSTRACT
Various blends of Mozzarella with 2 and 4 months semi-ripened Cheddar cheese were mixed at levels of 75:25, 50:50 and 25:75 respectively. Effect of different blends of cheeses on baking performance, viscosity and microstructure of pizza cheese were studied. The results showed that L* (whiteness) and -ve a*-values (green color) before and after cooking were significantly (P<0.05) decreased with increasing level and age of Cheddar cheese. The whiteness L* before and after cooking at 75:25 Mozzarella and 2 months semi-ripened Cheddar cheese was (79.45, 83.30) respectively. The values of whiteness before and after cooking at 25:75 Mozzarella and 4 months semi-ripened Cheddar cheese was reduced to 62.41, 79.68 respectively. Viscoelastic behavior showed that “Hot Apparent Viscosity” (HAV) decreased (971.67cP, 655.33cP) while time at 5000 cP viscosity (T5) increased (8.09S, 10.34S) significantly (P<0.05) with increasing proportion and ripening of Cheddar cheese. Microstructure indicated that size of serum channels reduced with higher level and ripening of cheddar cheese. In conclusion baking performance, viscosity and microstructure of Pizza cheese blends are affected by the ripening and blending of fresh and aged cheeses.
Keywords: Viscosity, Micro structure, Pizza cheese blend, Casein, Semi-ripened cheese.
INTRODUCTION
Pizza cheese is a nutrient rich dairy product characterizes through its various properties like viscosity, texture, color and flavor (El-bakry and Sheehan, 2014). A number of cheeses are being used as pizza cheese i.e. natural Mozzarella, Cheddar, Provolone, Parmesan, Emmental, Romano, Ricotta, Mozzarella analogue, Processed and Modified cheeses as described by Ma et al. (2014). Fresh cheeses have bland flavor however biochemical changes of ripening produce a variety of flavoring compounds that give unique flavor to ripened cheese. Primary events of biochemical changes of ripening include glycolysis, lipolysis and proteolysis that are the precursor of secondary metabolism converts fatty acids and amino acids into flavoring compounds (Murtaza et al., 2014).
Color of cheese is measured by Hunter’s L*, a, b indices. L* indices indicates the whiteness of cheese while a* value is an indicator of green (–) and red (+) color. The color value b* is an indicator of blue (–) and yellow (+) color in cheese (Hunter Lab, 2011). Whiteness of cheese is associated with its heterogeneous structure that is responsible for the scattering of light. It is also attributed with the presence intact casein and calcium. a* color is associated with the presence of reactions substrates (Lee et al., 2014).
Baking performance of cheeses as measured by color indices is an important quality attribute of pizza cheeses. Color is a sensory attribute that can enhance the flavor perception of consumers. It is an important attribute that plays a vital role for the acceptance and marketing of cheese Yates and Drake (2007). In some cheeses, when pleasant flavors such as nutty, buttery, and milky are missing, the consumer’s attention goes towards cheese color (Wadhwani and Mcmahon, 2012). Viscoelastic behavior is an important characteristic of cheeses (Bowland and Foegeding, 2001) and is also a parameter of significance for optimizing and modeling the technological conditions. It is important to characterize cheese melting behavior and its physical conditions that are good for its use in Italian dishes, pizzas and sandwiches according to Dimitreli and Thomareis (2004).
Cheese structure is the characteristics of rheological parameters and represents the exterior view of its microstructure. Various changes occur in the microstructure of milk components when milk is processed prior to cheese making. Ultimately, changes in milk microstructure modify the microstructure of resulting products. This realization thus encompasses specific molecular compositions and spatial arrangements (Claudia et al., 2009).
Chemical bonds are present among the protein matrix and membrane of fat globule in cheese. Casein micelles are adsorbed on the surface of fat particles that networked with other micelles, therefore fat globules also become the part of curd when treated with rennet and undergo changes during processing and ripening Hicky et al. (2015). Ripening is a biochemical reaction which occurs during storage of cheese and results in modification of microstructure. During storage water and protein redistribution are the major causes of change in structure of cheese as compared to change in fat globules positions. Small cavities are present in casein matrix of fresh cheese, as the ripening increases the fibrous matrix becomes elongated and enlargement of cavities weaken the protein matrix due to proteolysis Soodam et al. (2015).
Mozzarella is not a good finisher as hard cheese due to its clumpy and stringy nature, while a harder cheese becomes cohesive during melting. The manufacturers of processed cheese through years of work in cheese making, have understood and become skilled to select the suitable level of young and matured natural cheese in order to get processed cheese with preferred flavor and technological properties Meyer (1973); Thomas (1973). Keeping in view the need of consumers, pizza manufacturers and cheese producers, a study was planned to prepare pizza cheese blends by mixing young and aged natural cheeses at various proportions. The objective of study was to assess the effect of different proportions of cheeses (Mozzarella and Cheddar) and ripening months of Cheddar cheese on the baking performance (color), viscosity and microstructure of pizza cheese blends.
MATERIALS AND METHODS
Raw buffalo milk was obtained from the SB Dairy Farm Jhapal, Faisalabad to prepare Mozzarella and Cheddar cheeses. The milk was standardized at 3% fat for both types of cheeses Gulzar et al. (2016). Mesophillic culture Lactococcus lactis subsp. lactis and Lactococcus lactis subsp. cremoris and thermophillic culture Streptococcus thermophillus and Lactobacillus bulgaricus (Chr. Hansen Ireland Ltd., Rohan Industrial Estate, Little Island, Co. Cork, Ireland) were used for preparation of Cheddar and Mozzarella cheeses, respectively. Chymosin (50000u/G) from Pharm Chemical Co., Ltd. China, was used as coagulant for both Mozzarella and Cheddar cheeses Gulzar et al. (2019).
Preparation of Pizza cheese blends (PCBs):Cheddar cheese was prepared by following the method described by Rafiq et al. (2017) while Mozzarella cheese was manufactured according to the method of Zisu and Shah (2007) with slight modification in milling pH (pH 4.9) in order to standardize the processing steps for buffalo Mozzarella cheese. Pizza cheese blends were prepared by the method of Shirashoji et al. (2006) with slight variation. Pizza cheese blends were manufactured with a cooker (Blentech Corp., Rohnert Park, CA) that are fitted with steam injection direct and indirect way. Cheddar and Mozzarella cheeses were grated using a grinder. For the manufacturing of processed cheese steam cooker was pre-warmed to 80°C for 1 min; and then the grated cheeses according to required formulation of Mozzarella and Cheddar cheeses, distilled water (5%), and emulsifying salts (2%; 1:1) were added to the processing kettle and assorted at 50 rpm for the time period of 40 s. After mixing, direct steam (87 kPa) was incorporated for 100s. Heating was continued by indirect steam injection to 80°C for 10 minutes. Cheese was transferred into 2 kg pan and warehoused at 5°C overnight. Processed cheese vacuum-sealed repacked and stored at 5°C for more analysis.
Chemical composition of Mozzarella, Cheddar and Pizza cheese blends: Chemical analysis like moisture AOAC (2000), protein FIL-IDF (1964), fat Marshal (1993), total calcium and water soluble calcium Metzger et al. (2000) of natural and PCBs were determined according to their standardized respective methods.
Baking performance (color) of PCBs: Baking performance of pizza cheese blends were determined by measuring Hunter (L*, a*, b*) values before and after baking using Mini Scan portable colorimeter (Model CR-300, Minolta Camera Co, Tokyo, Japan Shaker et al. (2012). Three color indices were measured: L* (white to black), a* (-ve to +ve) (green to red), and b*(-ve to +ve) (blue to yellow). Each index was measured at 3 points around the circumference of the cheese before and after baking of pizza.
Viscosity of PCBs: Hot apparent viscosity (HAV) and Time to reach viscosity of 5000 cP (T5) for all PCBs were determined by using rapid visco-analyzer (RVA) as described by Kapoor and Metzger (2005).
Scanning electron microscopy of PCBs: The changes in structure of PCBs were examined by using scanning electron microscopy (SEM) following the method of Soodam et al. (2015). The samples were examined in a scanning electron microscope operated at an accelerating voltage of 1.6 kV.
Statistical analysis: All cheese blends were made in triplicate from Mozzarella and semi-ripened Cheddar cheese. Viscosity and baking performance parameters were analyzed using complete randomized design (CRD) and multiple degree of freedom contrast system in order to find the difference between means at significance level of 0.05 using Minitab Statistical Package. The means were compared using Turkey’s test after their significant difference Steel et al. (1997).
RESULTS AND DISCUSSION
Chemical composition of cheeses: The mean values for chemical composition of Mozzarella, Cheddar and Pizza cheese blends are depicted in Table 1.
Baking performance (color) of PCBs: L* (whiteness) and a* (green to red color) values of PCBs before and after baking varied significantly (P<0.05) with different combinations of fresh and aged cheeses.
Whiteness (L*) and green color (a*) of control (100% Mozzarella cheese) is more as compare to other PCBs. The whiteness and green color decreased as matured Cheddar cheese level increased for both before and after baking of pizza cheese blends (Table 2). The higher level of whiteness in blends with greater level of Mozzarella is due to higher level of moisture content and heterogeneous structure of Mozzarella which provides greater surface area for scattering of light Pastorino et al. (2002). The reduction in the strength of whiteness with advancement in maturing months of cheese is linked with decreased level of intact casein and bound calcium. The bound casein and calcium in the cheese are the main components that gives white color to cheese. Joshi et al. (2003) also reported decreased whiteness in cheeses with low calcium during maturation.
The changes in a* value (green to red color) with the blending of Mozzarella and Cheddar cheese is due to difference of reaction substrates of both cheese. Cheddar cheese has more reaction substrates due to increased levels of proteolysis and lipolysis and is more susceptible to browning as compared to Mozzarella cheese Metzger et al. (2000). As the proportion of Cheddar cheese and ripening period increases in the pizza cheeses, negative a* value becomes less. It is due to higher concentration of galactose that gives brown color due to its greater molar concentration and reactivity Dattatreya et al. (2010); Ma et al. (2014).
Viscosity of PCBs: It is evident from the results that significant (P<0.05) variation existed in HAV and T5 of PCBs due to Mozzarella and Cheddar cheese blending at various levels and ripening months. The mean values regarding HAV and T5 of pizza cheeses demonstrated that control sample (100% Mozzarella cheese) exhibited lowest HAV and highest T5 while increasing proportion and age of Cheddar cheese decreased HAV and increased T5 of pizza cheese blends Table 3.
Viscosity parameters (HAV and T5) of pizza cheeses significantly changes with the blending of Mozzarella and ripened Cheddar cheese. It is a consequence of difference of state of casein in Mozzarella and Cheddar cheese as indicated by proteolysis. HAV decreased with increasing level and ripening period of Cheddar cheese is due to reduction of intact casein. Salek et al. (2017) also observed similar results of viscoelastic behavior during storage.
On the contrary, T5 increased as the level of Cheddar cheese increased in pizza cheeses and the increasing effect was more pronounced in pizza cheeses with four months ripened Cheddar cheese. This is due to extensive protein-protein interactions in Mozzarella cheese that increase the viscosity and decrease time (T5) to reach the viscosity of 5000cP whereas, in ripened Cheddar cheese the protein becomes hydrolyzed therefore pizza cheeses with higher proportion of Cheddar cheese becomes less viscous and take more time to reach the viscosity of 5000cP Guinee et al. (2004); Lee et al. (2014).
Scanning electron microscopy of PCBs: The micrographs of pizza cheese blends with different proportions of cheese (Mozzarella and Cheddar) and ripening months (Cheddar) viewed by scanning electron microscopy are shown in Fig. 1. Prior to perform a microscopic observation through scanning electron microscopy fat was extracted from cheese. It is indicated from the micrograph that the control sample (PCB0) has large serum cavities and thicker protein network as compare to other PCBs.
The difference arises in microstructure is due to variation of Mozzarella and Cheddar cheese processing conditions. In Mozzarella cheese gelation was carried out at 37 0C which results more open structure as compared to other samples. In pizza cheese blends Cheddar cheese was used that had 30 0C gelation temperature. Hussain et al. (2012) studied microscopy of Mozzarella curd by confocal laser scanning electron microscope at 28, 34 and 39 0C gelation temperature. They observed similar results that pore size at 39 0C gelation temperature is comparatively greater as compared to 34 and 28 0C due to maximum entrapment of fat globules in serum phase and thicker protein strand that results maximum curd strength.
As viewed from the micrograph of PCBs the protein matrix becomes more hydrated and expanded as the proportion of ripened Cheddar cheese increased in the pizza cheese blends. In control sample protein-protein interactions were stronger and less whey remained inside the protein network perhaps due to more insoluble calcium that remained attached with protein network. In other samples (PCB1-PCB6) increased Cheddar cheese decreased level of insoluble calcium which led to more hydrated and expanded protein network due to entrapment of serum into cheese matrix. Mcmahon et al. (2005) also showed that increasing the Ca concentration in cheese induces stronger protein–protein interactions, and less whey remains entrapped within the protein matrix.
The micrographs from PCB4 to PCB6 indicated more hydrated structure as compared to PCB1-PCB3. In the former samples four months ripened cheese was used with more proteolysis as compared to later samples with two months ripened cheese therefore the changes in
Table 1. Chemical composition of Mozzarella, Cheddar and Pizza cheese blends
Components |
Mozzarella Cheese |
Cheddar cheese |
Pizza cheeses |
Ripening months |
|
2 |
4 |
PCB0 |
PCB1 |
PCB2 |
PCB3 |
PCB4 |
PCB5 |
PCB6 |
2 months
ripened |
4 months
Ripened |
M:C
100:0 |
M:C
75:25 |
M:C
50:50 |
M:C
25:75 |
M:C
75:25 |
M:C
50:50 |
M:C
25:75 |
Moisture % |
46.95±1.00 |
35.36 ±47 |
35.26 ±0.20 |
51.23±0.87 A |
50.80±0.62 B |
50.00±0.90 C |
47.54±0.57 D |
49.72±1.00 C |
47.81±0.57 D |
46.58±0.33 E |
Protein % |
25.36±1.18 |
28.23±0.20 |
28.20±0.10 |
25.37±0.54B |
26.07±0.28B |
26.70±0.49AB |
27.51±0.208A |
26.04±0.52B |
26.40±0.57AB |
27.58 ±0.43A |
Fat % |
23.25±1.80 |
29.33±1.15 |
29.03±1.19 |
23.00± 1.00B |
24.32± 0.66B |
26.67 ± 0.33A |
27.64 ± 0.66A |
24.33 ± 0.33B |
27.32 ± 0.88A |
28.35 ± 0.88A |
Total calcium mg/100g |
650±16.21 |
754±15.92 |
749±15.83 |
652 ± 26D |
676 ± 22CD |
702 ± 24ABC |
728 ± 28AB |
689 ± 26BCD |
722 ± 29ABC |
748 ± 30A |
Water soluble calcium mg/100g |
310±15.32 |
220±7.22 |
240 ±6.21 |
313 ± 12.5A |
287 ± 9.0B |
265 ± 10.5C |
242 ± 8.0D |
309 ± 10.0A |
285 ± 12.0B |
262 ± 8.5C |
M=Mozzarella cheese, C=Cheddar cheese, PCB (Pizza cheese blend), Values given are the means of the three replicates
Table 2. Effect of different proportion of Mozzarella and ripened Cheddar cheese blending on L* and a* values of pizza cheese blends.
Ripening months |
Treatments |
Mozzarella (%) |
Cheddar (%) |
L*-Values |
a*-values |
Mean ± SE |
Mean ± SE |
Mean ± SE |
Mean ± SE |
Before baking |
After baking |
Before baking |
After baking |
PCB0 |
100 |
0 |
81.90±1.16A |
85.34±0.53A |
-8.26±0.09 A |
-7.69± 0.06A |
2 |
PCB1 |
75 |
25 |
79.45±1.17A |
83.30±0.61AB |
-7.45±0.13 B |
-7.25± 0.02B |
PCB2 |
50 |
50 |
74.48±0.50B |
82.69±1.26BC |
-7.17±0.07 BC |
-6.75± 0.03C |
PCB3 |
25 |
75 |
71.51±0.86C |
80.37±0.55CD |
-7.11±0.07CD |
-6.25± 0.12D |
4 |
PCB4 |
75 |
25 |
69.29±0.69CD |
82.37±1.08BC |
-7.23±0.16BC |
-6.08± 0.06D |
PCB5 |
50 |
50 |
66.44±1.05D |
80.43±0.99CD |
-7.11±0.06CD |
-5.45± 0.03E |
PCB6 |
25 |
75 |
62.41±1.12E |
79.68±0.69D |
-6.88±0.06D |
-5.15± 0.07F |
Values within a row not sharing a common letter differed (P<0.05). Values presented are the means of three replicates; PCB= Pizza cheese blend
Table 3. Effect of different proportion of Mozzarella and ripened Cheddar cheese blending on HAV and T5 of pizza cheese blends.
Ripening months |
Treatments |
Mozzarella (%) |
Cheddar (%) |
HAV (cP) (Mean ± SE) |
T5 (S) (Mean ± SE) |
PCB0 |
100 |
0 |
971.67±54.44 A |
8.09±0.09 E |
2 |
PCB1 |
75 |
25 |
839.00±11.72 B |
9.14±0.07 D |
PCB 2 |
50 |
50 |
792.33±06.69 BC |
9.83±0.12 BC |
PCB 3 |
25 |
75 |
708.67±09.21 DE |
10.19±0.12 AB |
4 |
PCB 4 |
75 |
25 |
756.00±12.53 CD |
9.50±0.08 CD |
PCB 5 |
50 |
50 |
711.67±05.81 DE |
10.22±0.15 A |
PCB 6 |
25 |
75 |
655.33±11.35 E |
10.34±0.17 A |
Values within a row not sharing a common letter differed (P<0.05); Values presented are the means of three replicates; PCB= Pizza cheese blend
protein matrix takes place. During proteolysis the water moves from channels to protein matrix and make it swollen due to hydration Zisu and Shah (2005). Imm et al. (2003) also presented similar results as the maturation increased protein structure changed its arrangements and water moved from outside to inside of the protein network. Auty et al. (2001) described the protein hydration theory and explained that serum and whey channels disappeared during ripening of cheese.
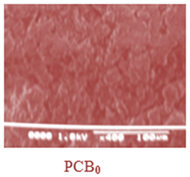
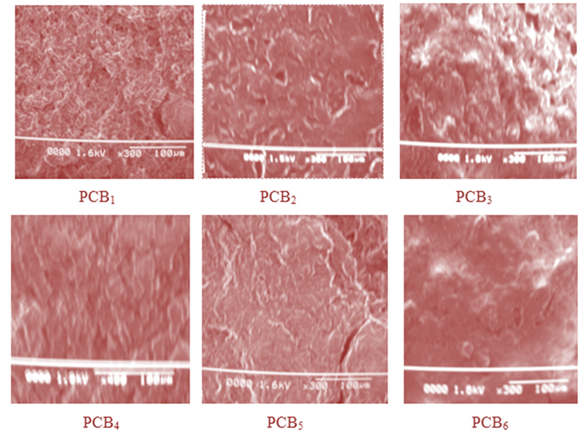
Fig.1. Change in microstructure of pizza cheese blends with proportion of cheese (Mozzarella and Cheddar) and ripening months of Cheddar cheese. PCB0 (Pizza cheese with 100% Mozzarella cheese), PCB1 (Pizza cheese with 75% Mozzarella cheese and 25% two months ripened Cheddar cheese), PCB2 (Pizza cheese with 50% Mozzarella cheese and 50% two months ripened Cheddar cheese, PCB3 (Pizza cheese with 25% Mozzarella cheese and 75% two months ripened Cheddar cheese), PCB4 (Pizza cheese with 75% Mozzarella cheese and 25% four months ripened Cheddar cheese), PCB5 (Pizza cheese with 50% Mozzarella cheese and 50% four months ripened Cheddar cheese, PCB6 (Pizza cheese with 25% Mozzarella cheese and 75% four months ripened Cheddar cheese).
Acknowledgment: Authors acknowledge Higher Education Commission (HEC), Pakistan, for research funding.
REFERENCES
- AOAC. (2000). Official method of analysis. The Association of Official Analytical Chemists.17th Ed. Washington, DC.
- Auty, M.A., M. Twomey, T. Guinee, and D.M. Mulvihill (2001). Development and application of confocal scanning laser microscopy methods for studying the distribution of fat and protein in selected dairy products. Cork (Ireland). J. Dairy Res. 68 (3): 417–427.
- Bowland, E.L. and E.A. Foegedin (2001). Small strain oscillatory shear and microstructural analyses of a model processed cheese. Raleigh (United States of America). J. Dairy Sci. 84: 2372–2380.
- Claudia, I.P., M.P. Gana, and F.X. Malcata (2009). Microstucture of cheese: Processing, technological and microbiological considerations. Porto (Portugal). Trends Food Sci. Technol. 20 (5): 213-219.
- Dattatreya, A., W. Lee, and S. Rankin (2010). Short communication: Presence of galactose and glucose promotes browning of sweet whey powder. Jinju (South Korea). J. Dairy Sci. 93: 2354–2357.
- Dimitreli, G. and S.T. Apostolos (2004). Effect of temperature and chemical composition on processed cheese apparent viscosity. Thessaloniki (Greece). J. Food Eng. 64(2): 265–271.
- El-bakry, M. and S. Jeremiah (2014). Analysing cheese microstructure: A review of recent developments. . Cork (Ireland). J. Food Eng.125: 84–96.
- Guinee, T.P., M. Caric, and M. Kalab (2004). Pasteurized processed cheese and substitute/imitation cheese products. Cork (Ireland). Cheese: Chemistry, Physics and Microbiology. 2: 349-392p.
- Gulzar, N., A. Sameen, N. Huma, and M. Shahid (2016). Influence of mozzarella and semi-ripened cheddar cheese amalgamations on the chemical composition and textural attributes of processed pizza cheese. Faisalabad (Pakistan). Pakistan J. Agri. Sci. 53(1): 209-216.
- Gulzar, N., S. Rafiq, M. Nadeem, M. Imran, A. Khalique, I. M. Sleem, and T. Saleem (2019). Influence of milling pH and storage on quality characteristics, mineral and fatty acid profile of buffalo Mozzarella cheese. Lahore (Pakistan). Lipids Health Dis. 33 (18). doi: 10.1186/s12944-019-0976-9.
- Hickey, C.D., J.J. Sheehan, M.G. Wilkinso, and M.A.E. Auty (2015). Growth and location of bacterial colonies within dairy foods using microscopy techniques: A review. Limerick (Ireland). Front Microbiol.6: 99.
- Hussain, I., A.S. Grandison, and A.E. Bell (2012). Effects of gelation temperature on Mozzarella-type curd made from buffalo and cows’ milk. 1: Rheology and microstructure. Reading (United Kingdom). Food Chem. 134 (3): 1500–1508.
- Hunter Lab. 2011. Measurement values. Chapter 9 in D25LT User’s Manual, Version 1.4. Accessed Oct. 26, 2011. Reston (Virginia). http://www.hunterlab.com/ Training Support/ User Manuals /D25LT Manual.
- International Dairy Federation. 1964. Determination de la teneuren case ine du lait, International StandardFIL-IDF. Brussels (Belgium). Lait. 29.
- Imm, J.Y., E.J. Oh, K.S. Han, S. Oh, Y.W. Park, and S.H. Kim (2003). Functionality and physico-chemical characteristics of bovine and caprine Mozzarella cheeses during refrigerated storage. Seoul (Korea). J. Dairy Sci. 86: 2790-2798.
- Joshi, N.S., K. Muthukumarappan, and R.I. Dave (2003). Effect of calcium on physicochemical properties of fat-free Mozzarella cheese. Brookings (South Dakota). J. Food Science. 68 (7): 2289–2294.
- Kapoor, R. and L.E. Metzger (2005). Small-scale manufacture of process cheese using a rapid visco analyzer. Minnesota (United States of America). J. Dairy Sci. 88: 3382-3391.
- Lee, H., S.A. Rankin, L.M. Fonseca, and F.X. Milani (2014). Lactose and galactose content in cheese results in overestimation of moisture by vacuum oven and microwave methods. Madison (Wisconsin). J. Dairy Sci. 97 (5): 2567–2577.
- Ma, X., M.O. Balaban, L. Zhang, E.A. Emanuelsson-Patterson, and B. James (2014). Quantification of pizza baking properties of different cheeses and their correlation with cheese functionality. (Auckland New Zealand). J. Food Sci. 79 (8): 1528-1534.
- Marshall, R.J. 1993. Physicochemical properties accounting for cheese texture. London (United Kingdom). Acta Psychol. 84 (1): 69‐77.
- McMahon, D.J., B. Paulso, and C.J. Oberg (2005).Influence of calcium, pH and moisture on protein matrix structure and functionality in direct acidified non-fat Mozzarella cheese. Logan Utah (United States of America). J. Dairy Sci. 88 (1): 3754-3763.
- Metzger, L.E., D.M. Barbano, M.A. Rudan, P.S. Kindstedt, and M.R. Guo (2000). Whiteness changes during heating and cooling of Mozzarella cheese. Ithaca New York. J. Dairy Sci. 83 (1): 1-10.
- Meyer, A. (1973): Processed cheese manufacture. Food Trade Press, London, UK.
- Murtaza, M.A., S. Ur-Rehman, F. M. Anjum. N. Huma, and I. Hafiz (2014). Cheddar Cheese Ripening and Flavor Characterization: A Review. Crit Rev Food Sci Nutr. 54(10):1309-1321.
- Ong, L., A. Henriksson, and N.P. Shah (2006). Development of probiotic Cheddar cheese containing Lb. acidophilus, Lb. paracasei, Lb. casei and Bifidobacterium spp. and the influence of these bacteria on proteolytic patterns and production of organic acid. Intl. Dairy J. 16 (5): 446–456.
- Pastorino, A.J., R.I. Dave, C.J. Oberg, and D.J. Mcmahon (2002).Temperature effect on structure-opacity relationship of nonfat Mozzarella cheese. Logan Utah (United States of America). J. Dairy Sci. 85 (9): 2106–2123.
- Rafiq S., N. Huma, I. Pasha, N. Gulzar, M. Shahid, and H. Xiao (2017). Exposure of raw-264.7 macrophage cell line to water-soluble extract of cheddar cheese: assessment of antioxidant activity. The J. Anim. Plant Sci. 27(2): 611-616.
- Salek, R.N., C. Michaela, P. Vendula, Zuzana, B., Veronika, K, and Frantisek, B. (2017). Properties of spreadable processed Mozzarella cheese with divergent compositions of emulsifying salts in relation to the applied cheese storage period. LWT. Masaryka (Czechia). Food Sci. Technol. 77: 30-38.
- Shaker, R.R., A. Attlee, H. Kasi, T.M. Osaili, A.A.A. Nabulsi, and H.A. Ababneh (2012). Comparison of the quality of low moisture mozzarella cheese made from bovine, ovine and caprine milks. Sharjah (United Arab Emirates). J. Food Agri. Environ. 10 (2): 89-93.
- Shirashoji, N., J.J. Jaeggi, and J.A. Lucey (2006). Effect of trisodium citrate concentration and cooking time on the physicochemical properties of pasteurized process cheese. Kanagawa (Japan). J. Dairy Sci. 89 (1): 15–28.
- Soodam, K., O. Lydia, B.P. Ian, E.K. Sandra, and L.G. Sally (2015). Effect of calcium chloride addition and draining pH on the microstructure and texture of full fat Cheddar cheese during ripening. Food Chem. 181: 111–118.
- Steel, R.G.D., J.H. Torrie, and D.A. Dickey (1997). Principles and procedures of statistics. A Biometrical Approach.3rd Ed. McGraw Hill Book Co. Inc. New York.
- Thomas, M.A., G. Newell, and G.A. Abad (1980). Effects of freezing on the objective and subjective properties of processed cheese. Richmond (Australia). J. Food Technol. 15 (6): 599–605.
- Wadhwani, R. and D.J. Mcmahon (2012). Color of low-fat cheese influences flavor perception and consumer liking. Logan Utah (United States of America). J. Dairy Sci. 95 (5): 2336-2346.
- Yates, M.D. and M.A. Drake (2007). Texture properties of Gouda cheese. Raleigh (United States of America). J. Sens. Stud. 22 (5): 493–506.
- Zisu, B. and N.P. Shah (2005). Textural and functional changes in low fat Mozzarella cheeses in relation to proteolysis and microstructure as influenced by the use of fat replacers, pre-acidification and EPS starter. Victoria (Australia). Intl. Dairy J. 15 (6): 957-972.
- Zisu, B. and N.P. Shah (2007). Texture characteristics and pizza bake properties of low fat mozzarella cheeses as influenced by pre‐acidification with citric acid and use of encapsulated and ropy exopolysaccharide producing culture. Intl Dairy J. 17 (8): 985‐997.
|


