The Journal of Animal & Plant Sciences, 30(1): 2020, Page: 205-211
ISSN: 1018-7081
PHYSICO-CHEMICAL ANALYSIS AND OPTIMIZATION OF ULTRASOUND ASSISTED EXTRACTION OF PHYTOCHEMICALS FROM KING’S RUBY GRAPES
M. Kaleem*, A. Ahmad1, T. Masud1and G. K. Raja2
1Institute of Food and Nutritional Sciences, PMAS-Arid Agriculture University Rawalpindi, Punjab, Pakistan
2 University Institute of Biochemistry and Biotechnology, PMAS-Arid Agriculture University Rawalpindi, Punjab, Pakistan
*Corresponding Author’s email: Kaleem.ft@gmail.com
ABSTRACT
King’s ruby is a seedless variety of grapes grown in the Phothohar region of Pakistan. In the present study, nutritional value of King’s ruby grapes was determined and extraction conditions were optimized using response surface central composite rotatable design of RSM using three variables at five levels. To get maximum yield of total phenolic content and total flavonoid content, the best combination of time of extraction, temperature of extraction and solvent concentration was determined. The process variable of time has the maximum effect on the functional components of extraction. The optimized condition for all the three parameters extract yield, total phenolic content and total flavonoid content was found to be 22.05 min time, 50.3 °C and 46.7 % ethanol concentration. The experimental result showed 4.84 mg/100g extract yield, 1.98 mg GAE/g phenolic content and 4.92 mg QEQ/g flavonoid content that is as per with predicted values. It is concluded that flavonoid content can be extracted efficiently using ultrasonic extraction that has a potential to be used as nutraceutical food ingredient. Ultrasonic extraction can efficiently extract bioactive components at low temperature and short period of time with maximum recovery.
Key Words: Ultrasound, Flavonoid, Response Surface, Optimization.
INTRODUCTION
Grapes (Vitis vinifera) are known to be used by humans for food and medicinal purpose through centuries. The fruit of grapes is a berry which grows in clusters. Grapes may be eaten fresh as table grapes or may be processed into different products like juice, wine or it may be dried to get raisins.
Flavonoids are biologically active compounds that possess antibacterial, antifungal, antiviral and antioxidant properties. Similarly, flavonoids help in controlling the oxidation of low density lipoprotein (LDL) and promote cardiovascular health. These properties of flavonoids can be used for the development of nutraceutical products (Ahmad et al. 2015). Extract of grapes rich in flavonoids is an important nutraceutical ingredient of food. For effective utilization of these phytochemicals it is necessary to understand the chemistry of flavonoid constituents in different food matrices and to improve the method of extraction, characterization, authentication and quantification of these phytochemicals and assess their biological activity against different diseases (Cushnie and Lamb 2005, Ahmad et al. 2015, Khalid et al. 2017).
Fick's 2nd law of diffusion is used for description of bioactive compounds extraction (Herodež, Hadolin et al. 2003). Extraction yield is primarily dependent on the concentration of solvent, time of extraction and the temperature of extraction (Spigno, Tramelli et al. 2007). A most suitable and environmental friendly method is that which utilizes low concentration of solvent, have less extraction time and low temperature used for extraction (Wang and Weller 2006).
Conventional techniques used for extraction of phytochemicals include solvent extraction, hydro distillation, maceration, Soxhlet extraction and enzymatic extraction. These techniques have several drawbacks, which include longer extraction time, high cost, concentrated or pure solvent and heat sensitive compound decomposition (Kaleem and Ahmad, 2018). To overcome these problems of conventional extraction techniques several new techniques have been developed which include super critical flavonoid extraction; microwave assisted extraction and ultrasound assisted extraction (Kaleem and Ahmad, 2018, Wang, Wu et al 2012).
Ultrasound assisted extraction technique is simple, has less instrumental requirements, is inexpensive and is relatively efficient for extraction as compared to conventional techniques. In this technique extraction is enhanced by ultrasound because these waves produce acoustic cavitations in the solvent (Wang et al. 2008). Similarly, ultrasound waves also helps in the penetration of solvent into the sample material and thus increases the contact area of solvent to sample as a result the solute diffuses more rapidly from sample into the solvent (Rostagno et al. 2003).
Grapes are grown all over Pakistan, especially in the province of Baluchistan but now a day Pothohar area in Punjab province is recognized as favorable area for the cultivation of different varieties of grapes. Farmers are also recognizing its importance due to high economic returns and gaining popularity for its cultivation. Area under grape cultivation is increasing continuously and similarly the production of grapes has increased tremendously. King’s Rubi is early maturing variety widely grown in Pakistan, so the present research was carried out to determine the phytochemical components of this variety and to optimize condition for extraction of these compounds using ultrasound assisted extraction technique.
MATERIALS AND METHODS
Sample was collected from Pothowar grapes farm located in the Kallar Syedan Tehsil of district Rawalpindi and Al Awan grapes farms located in Attock, at fully mature stage. Samples were collected from five different plants in equal quantity and then composite sample was made. Sample was precooled using ice and transported to the Department of Food Technology PMAS Arid Agriculture University Rawalpindi. The samples were washed and cleaned to remove dust and any other undesirable things. After that the samples were blanched at 55-60 ○C for 5 minutes to deactivate enzyme activity that was followed by oven drying at 45 ○C under vacuum. Dried samples were ground to powder form that was sealed in air tight glass bottles which was stored at -4 + 2 ○C and was used for future analysis (Mishra et al. 2012).
Proximate analysis of Grapes: Crude fat, carbohydrate, crude protein, moisture and ash content of grapes was estimated in triplicate by adopting standard method of analysis and result is described as mean (AOAC 2000). Samples moisture content was determined by drying the sample at 105 °C until constant weight is achieved. Fat was extracted by Soxhlet extraction with hexane and by using Kjeldahl method crude protein content was determined. The percentage of carbohydrate was calculated by subtracting fat, percent protein, ash and moisture percentage from a value of 100. The nutritional value was calculated by following formula (Ahmed et al. 2011):

Extraction of Phytochemicals: Powdered grape sample (2 g) was kept in a volumetric flask and volume was made up to 100 ml with the extraction solvent. Mixing was done using magnetic stirrer for 5 minutes. After mixing ultrasound assisted extraction was carried out on sonication water bath. The power and frequency was set at 250W and 40 kHz respectively. Extraction time, temperature and concentration of ethanol was maintained at different levels as described in the Table 1. Ethanol concentrations used at different levels include 33.2, 40, 50, 60 and 66.8%. Response surface methodology (RSM) was used to model the experiment using central composite rotatable design. After extraction the sample was cooled to room temperature using chilled water. Filtration of extract was done using Whattman No. 5 under vacuum. This extract was used for future analysis of phenolic content and flavonoid content.
Extraction Yield: Extract was concentrated using rotary evaporator. The concentrated extract was dried in vacuum oven till constant weight. The weight of residue is used to calculate extract yield as g/100 g dry matter basis (Li, Skouroumounis et al. 2011).
Determination of Phenolics: Total phenolic content of grape extract was measured by spectroscopic technique using Follin-Ciocalteu’s phenol reagent. Diluted extract of sample (1ml) was mixed with the 9 ml of deionized water in a flask. After 5 minutes 10 ml of 7% sodium carbonate was added. The mixture was diluted to get volume of 25 ml and was mixed thoroughly. The resulting mixture was incubated at room temperature for about eighty minutes. The absorbance of mixture was measured at 750 nm using spectrophotometer. Solution of gallic acid having concentration in the range of 0-200 mg/l was prepared and was used to construct calibration curve (Kim et al. 2003).
Table 1. Factors used and their level employed in response surface methodology.
|
Level coded |
|
-α (-1.68) |
-1 |
0 |
+1 |
+α(1.68) |
Variables |
Actual level |
Time |
(11.6) |
15 |
20 |
25 |
(28.4) |
Temperature |
(33.2) |
40 |
50 |
60 |
(66.8) |
Determination of Flavonoids: Total flavonoid content of grape was determined by the method of Makris, Boskou et al. (2007) 0.1 ml of diluted extract was mixed with 0.4 ml of deionized water in a micro centrifuge tube of 2 ml, 0.03 ml of KNO3 (5%) was added and was kept at room temperature for 5 min. after this 0.03 ml of AlCl3 (10%) was added and the mixture was incubated at room temperature for further 5 minutes. At last, 0.2 ml Na2CO3 (1M) and 0.24 ml distilled water was added to the mixture and absorbance was measured at 519 nm. Results was expressed as quercetin equivalent equivalent (QEQ) (Makris et al. 2007).
Statistical Analysis: A 3-factor, 5 level central composite design consisting of 20 runs was used to check the effect of time, temperature and concentration of solvent on grape phytochemicals. The design was analyzed by Design-Expert (Version 7.0.0) software. The regression coefficients were calculated and significant effect of independent variable was analyzed. Three dimensional surface graphs were plotted for independent variables and optimized conditions were calculated using Design-Expert software.
RESULTS AND DISCUSSION
Grapes were analyzed for moisture, fat, carbohydrate and ash content. Nitrogen content was determined by Kjeldhal apparatus and protein content was calculated by multiplying nitrogen content with factor 6.25. Energy value was calculated by adding the result of multiplying, protein and carbohydrate content by 4 and fat content by multiplying with 9. The result showed that grapes contain 74.16% moisture, crude protein 2.18%, carbohydrate 22.81% and ash 0.81%. The calculated energy value was found to be 98 K calories/100 g.
Central composite design was used to optimize ultrasonic extraction condition for extract yield, total phenolic content, total flavonoid content and antioxidant activity determined by DPPH assay. Extract yield, total phenolic content, flavonoid content and antioxidant activity determined at various levels is presented in Table 2. Analysis of variance, lack of fitness relative to noise and significance of models are presented in Table 3. Model is statistically significant at p<0.05 and lack of fit is non-significant with relative to pure error.
Table 2. RSM Design, three variables central composite design for Extract yield, total phenolics and total flavonoids.
Runs |
Time (min) |
Temperature (○C) |
Solvent Concentration (%) |
Yield (g/100g) |
TPC mg GAE/g |
TF (mgQEQ/g) |
1 |
1(25) |
1(60) |
1(60) |
1.121 |
6.567 |
4.68 |
2 |
0(20) |
0(50) |
1.68(66.8) |
1.015 |
6.538 |
3.63 |
3 |
1(25) |
-1(40) |
1(60) |
1.224 |
8.79 |
3.98 |
4 |
0(20) |
0(50) |
0(50) |
2.234 |
10.98 |
4.55 |
5 |
-1(15) |
1(60) |
-1(40) |
1.149 |
5.483 |
5.94 |
6 |
-1.68(11.6) |
0(50) |
0(50) |
1.134 |
3.96 |
5.34 |
7 |
-1(15) |
1(60) |
1(60) |
1.111 |
4.44 |
4.81 |
8 |
0(20) |
0(50) |
-1.68 (33.2) |
1.299 |
5.25 |
5.74 |
9 |
1(25) |
1(60) |
-1(40) |
1.239 |
5.94 |
5.71 |
10 |
0(20) |
0(50) |
0(50) |
2.242 |
10.31 |
4.56 |
11 |
0(20) |
1.68 (66.8) |
0(50) |
0.878 |
9.817 |
4.84 |
12 |
0(20) |
0(50) |
0(50) |
2.224 |
11.39 |
4.67 |
13 |
-1(15) |
-1(40) |
-1(40) |
0.87 |
4.92 |
4.87 |
14 |
0(20) |
0(50) |
0(50) |
2.212 |
10.341 |
4.85 |
15 |
1.68(28.4) |
0(50) |
0(50) |
1.283 |
7.35 |
6.16 |
16 |
0(20) |
-1.68 (33.2) |
0(50) |
1.096 |
11.317 |
4.42 |
17 |
0(20) |
0(50) |
0(50) |
2.442 |
11.24 |
4.75 |
18 |
1(20) |
-1(40) |
-1(40) |
1.219 |
5.31 |
5.95 |
19 |
0(20) |
0(50) |
0(50) |
2.232 |
11.88 |
4.93 |
20 |
-1(15) |
-1(40) |
1(60) |
1.173 |
5.442 |
4.34 |
Table 3. Regression Coefficients for extract yield, total phenolics and total flavonoids content.
|
Yield |
TPC |
TFC |
b0 |
2.26 |
11.06512 |
4.723224 |
b1 |
0.055 |
0.880384 |
0.12807 |
b2 |
-.017 |
-0.33351 |
0.196784 |
b3 |
-0.024 |
0.421191 |
-0.60018 |
b11 |
-0.35 |
-2.17006 |
0.36361 |
b22 |
-0.043 |
-0.43341 |
-0.03248 |
b33 |
-0.037 |
-2.08556 |
-0.0137 |
b12 |
-0.037 |
-0.14425 |
-0.13425 |
b13 |
-0.047 |
0.5785 |
-0.16863 |
b23 |
-0.058 |
-0.55225 |
0.042065 |
Extract Yield: Extraction yield of ultrasonic extracts is shown in Table 2, which is based on central composite design. Experimental data was analyzed for multiple regression and the model coefficients were evaluated for significance. The results showed that extraction time significantly affects the yield of extracts. Similar results are reported by Ghafoor, Choi et al. (2009) who obtained higher extracts yield with increasing time of extraction. The coefficient values for extract yield are presented in Table 3, based on these values predictive equation is formulated neglecting/confounding the non significant terms.
Yield =2.261+0.05496A-0.01703B-0.02384C-0.3542A2-0.4325B2-0.3724C2 (1)
By using equation 1 three dimensional plots were constructed to optimize the variable for obtaining maximum yield. Extraction process, time significantly affected the yield of extract from Vitis vinifera. Effect of time and temperature on the extract yield is represented in Figure 1. It shows quadratic effect of time of extraction and temperature on the extract yield, with the increase in time and extraction temperature extract yield increased initially and reached to maximum, after that the extract yield decreased gradually. Phenolic compounds are destroyed at high temperature thus decreasing the yield of extract at high temperature. The effect of time of extraction and concentration of solvent while keeping the temperature constant is represented in Figure 1B which shows quadratic effect of time and concentration of solvent on the extract yield.

Figure 1. Response surface graph of extract yield as affected by time, temperature and ethanol concentration (A) Fixed level: ethanol concentration 50% (B) Fixed level: temperature 50 ○C
Total Phenolic Content (TPC): Total phenolic content of ultrasonic extracts is shown in Table 2, which is based on central composite design. Experimental data was analyzed for multiple regression and the model coefficients were evaluated for significance. The results showed that extraction time significantly affects the total phenol content of extracts. Similar results are reported by Ghafoor, Choi et al. (2009) who obtained higher total phenol content with increasing time of extraction. The coefficient values for extract total phenolic contentare presented in Table 3, based on these values predictive equation is formulated neglecting/confounding the non significant terms.
TPC=+11.065+0.881A-0.34B+0.4212C+0.5785AC-2.17A2-0.433B2-2.085C2 (2)
By using equation 2 three dimensional plots were constructed to optimize the variable for obtaining maximum total phenolic content in the extract. Extraction process significantly affected the yield of extract from Vitis vinifera. The effect of time and temperature on total phenolic of extract is represented in Figure 2, which shows quadratic effect of time of extraction and temperature on the total phenolic content of extract while keeping the concentration of solvent constant, with the increase in time and extraction temperature total phenolic content increased initially and reached to maximum, after that the total phenolic content decreased gradually. This might be due to destruction of phenolic compounds with increase in temperature that leads to reduction of total phenol content. The effect of time of extraction and concentration of solvent while keeping the temperature constant is represented in Figure 2B which shows quadratic effect of time and concentration of solvent on the total phenolic content of extract while keeping the temperature constant. A potential benefit of using ultrasound assisted extraction is the time required in minutes as compared to conventional methods that require time in hoursor even in days i.e. solvent extraction using shaker for overnight. Effect of temperature of extraction and concentration of solvent on the total phenolic content of extract while keeping the time constant is shown in Fig 2C. With the increase in solvent concentration the total phenolic content decreased while with the increase in temperature keeping the time constant the total phenol content increased linearly with increase in temperature. Similar quadratic effect was observed by Jeganathan et al. (2014) who optimized the condition using Box Behnken design and observed quadratic effect of time and temperature for extraction of phenolics from red grapes.

Figure 2. Response Surface graph of total phenol content as affected by time, temperature and ethanol concentration (A) Fixed level: ethanol concentration 50% (B) Fixed level: temperature 50 ○C (C) Fixed level: time 20 min.
Total Flavonoid Content (TFC): Total flavonoid content of ultrasonic extract carried out at different levels of time, temperature and concentration of solvent is shown in Table 2. Experimental data based on central composite design of response surface methodology was analyzed by Design expert software for multiple regressions and checked for significance of model coefficients. The results showed that extraction time significantly affects the total phenol content of extracts. Similar results are reported by Ghafoor et al. (2009) who obtained higher total phenol content with increasing time of extraction. The coefficient values for extract total flavonoid content are presented in Table 3, based on these values predictive equation is formulated neglecting/confounding then on significant terms.
TFC=+4.72+0.128A+0.197B-0.6C-0.168AC+0.36A2-0.032B2-0.014C2 (3)
Maximum flavonoids (11.88 mg QEQ/g) were extracted in experimental run 19 in which temperature was 50 ○C, solvent concentration 50% with 20 min time of extraction, while lowest flavonoid content were extracted in experimental run 6, in which time of extraction was 11.6 min at a temperature of 50○C with 50% solvent concentration. This shows that at optimum temperature and concentration of solvent, flavonoid content of extract increased up to 20 min, and then gradually decreased. This might be due to overheating of flavonoids compounds for longer period of time resulting in quadratic effect. By using equation three dimensional plots were constructed to optimize the variable for obtaining maximum total flavonoid content in the extract. Extraction process significantly affected the flavonoid content of extract from Vitis vinifera. Effect of time and temperature on the extract total flavonoid content is represented in Figure 3, which shows linear effect of time of extraction on the total flavonoid content of extract while keeping the concentration of solvent constant, with the increase in time of extraction the total flavonoid content increased linearly while with the increase of temperature the total flavonoid content increased linearly. The effect of time of extraction and concentration of solvent while keeping the temperature constant is represented in Figure 3B which shows that solvent concentration did not affect the total flavonoid content of extract while increase in time of extraction increased the total flavonoid content of extract. Effect of temperature of extraction and concentration of solvent on the total flavonoid content of extract while keeping the time constant is shown in Fig 3C. With the increase in solvent concentration the total phenolic content did not changed significantly while with the increase in temperature keeping the time constant the total flavonoid content increased linearly with increase in temperature. Similar quadratic effect was observed by Jeganathan, Venkatachalam et al. (2014) in which temperature was optimized as 57 °C while the time required was optimized as 61 min, much higher than this study. This difference in temperature is due to use of ultrasonic waves which produce cavitation’s and break the vegetal matrix helps to extract compounds from matrix (Vinatoru et al. 1997).
Optimization of Conditions for Bioactive Compounds Extraction: The optimized conditions for extract yield, total phenolic content and total flavonoid content are represented in Table 4 the values of R2 and R2 adjusted sowed that model adequately represent the relationship process variables. For comparison of predicted results with actual results the experiments was conducted at optimized conditions and the results are represented in Table 4. The experimental values validated the RSM model and proved that model is effective in predicting the responses. The findings of the present study are as per of Wang, Wu et al. (2012) who optimized the condition for extraction of phenolic acids and flavonoids from Sparganii rhizoma and found the concentration of ethanol as 53.62%, while the time required for extraction in this study is lower as compared to Wang et al. (2012) in which time was optimized as 29.41 min. This difference in time might be due to third variable studied i.e. temperature whose effect was not studied by Wang et al. (2012). It is concluded that ultrasonic assisted extraction helps to extract bioactive compounds at comparatively low temperature requiring less time of extraction. Ultrasound assisted extraction is a modern technique for the extraction of wide variety of phytochemicals taking less time and requires less volume of solvent that is a major environmental concern for green technologies.
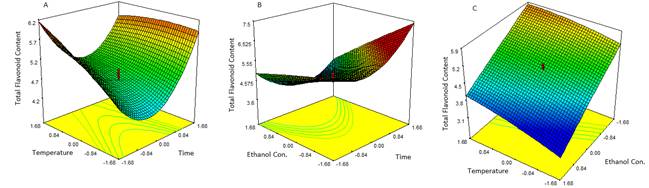
Figure 3. Response Surface graph of total phenol content as affected by time, temperature and ethanol concentration (A) Fixed level: ethanol concentration 50% (B) Fixed level: temperature 50 ○C (C) Fixed level: time 20 min.
Table 4. Optimized conditions of factors, predicted and experimental values of responses at optimized conditions.
Response Variable |
R2 |
R2-adjusted |
Time (Min) |
Temperature (°C) |
Ethanol concentration (%) |
Estimated |
Experimental |
Desirability |
Yield |
0.97 |
0.956 |
20.4 |
49.8 |
49.6 |
2.26 |
2.15 |
0.88 |
TPC (mgGAE/g) |
0.92 |
0.89 |
21.1 |
46.2 |
51.3 |
11.25 |
10.94 |
0.92 |
TFC (mg QEQ/g) |
0.93 |
0.87 |
23.9 |
50.3 |
43.6 |
6.26 |
6.04 |
0.92 |
Conflict-of-interest: All authors did not have any form of conflict of interest.
Acknowledgment: Authors are thankful for Higher Education Commission of Pakistan (HEC) for providing funds through indigenous fellowship scheme to carry out this study and Department of Home and Health Sciences, Allama Iqbal Open University Islamabad for allowing conducting some part of work in their laboratory.
REFERENCES
- Ahmad, A., M. Kaleem, Z. Ahmed and H. Shafiq (2015). Therapeutic potential of flavonoids and their mechanism of action against microbial and viral infections—A review. Food Res. Int. 77: 221-235.
- Ahmed, D., A. Waheed, M. A. Chaudhary, S. R. Khan, A. Hannan and M. Barkaat (2011). Nutritional and antimicrobial studies on leaves and fruit of Carissa opaca Stapf ex Haines. Asian J. Chem. 23(5): 2072-2076.
- AOAC (2000). Official Methods of Analysis. Association of Analytical Chemist (15th Ed.) Virginia, 22201, Arlington, USA.
- Cushnie, T., and A. J. Lamb (2005). Antimicrobial activity of flavonoids. Int. J. Antimicrob. Agents 26(5): 343-356.
- Ghafoor, K., Y. H. Choi, J. Y. Jeon, and I. H. Jo (2009). Optimization of ultrasound-assisted extraction of phenolic compounds, antioxidants, and anthocyanins from grape (Vitis vinifera) seeds. J. Agric. Food Chem. 57(11): 4988-4994.
- Herodež, Š. S., M. Hadolin, M. Škerget, and Ž. Knez (2003). Solvent extraction study of antioxidants from Balm (Melissa officinalis L.) leaves. Food Chem. 80(2): 275-282.
- Jeganathan, P. M., S. Venkatachalam, T. Karichappan, and S. Ramasamy (2014). Model development and process optimization for solvent extraction of polyphenols from red grapes using Box–Behnken design. Prep. Biochem. and Biotech. 44(1): 56-67.
- Khalid, S., A. Ahmad, and M. Kaleem (2017). Antioxidant Capacity and Phenolic Contents of Ajwa Date and Their Effect on Lipo-Protein Profile. Functional Foods Health Dis. 7(6): 396-410.
- Kaleem, M., and A. Ahmad (2018). Chapter 8 - Flavonoids as Nutraceuticals. Therapeutic, Probiotic, and Unconventional Foods. A. M. Grumezescu and A. M. Holban, Academic Press: 137-155.
- Kim, D.-O., S. W. Jeong, and C. Y. Lee (2003). Antioxidant capacity of phenolic phytochemicals from various cultivars of plums. Food Chem. 81(3): 321-326.
- Li, Y., G. K. Skouroumounis, G. M. Elsey, and D. K. Taylor (2011). "Microwave-assistance provides very rapid and efficient extraction of grape seed polyphenols." Food Chem. 129(2): 570-576.
- Makris, D. P., G. Boskou, and N. K. Andrikopoulos (2007). Polyphenolic content and in vitro antioxidant characteristics of wine industry and other agri-food solid waste extracts. J. Food Comp. Anal. 20(2): 125-132.
- Mishra, G. J., M. Reddy, and J. S. Rana (2012). "Isolation of flavonoid constituent from Launaea procumbens Roxb. by preparative HPTLC method." IOSR J Pharm. 2: 5-11.
- Rostagno, M. A., M. Palma, and C. G. Barroso (2003). Ultrasound-assisted extraction of soy isoflavones. J. Chrom. A 1012(2): 119-128.
- Spigno, G., L. Tramelli, and D. M. De Faveri (2007). Effects of extraction time, temperature and solvent on concentration and antioxidant activity of grape marc phenolics. J. Food Eng. 81(1): 200-208.
- Vinatoru, M., M. Toma, O. Radu, P. Filip, D. Lazurca, and T. Mason (1997). The use of ultrasound for the extraction of bioactive principles from plant materials. Ultr. sonochem. 4(2): 135-139.
- Wang, J., B. Sun, Y. Cao, Y. Tian, and X. Li (2008). Optimisation of ultrasound-assisted extraction of phenolic compounds from wheat bran. Food Chem. 106(2): 804-810.
- Wang, L. and C. L. Weller (2006). Recent advances in extraction of nutraceuticals from plants. Trends in Food Sci. Tech. 17(6): 300-312.
- Wang, X., Q. Wu, Y. Wu, G. Chen, W. Yue and Q. Liang (2012). Response surface optimized ultrasonic-assisted extraction of flavonoids from Sparganii rhizoma and evaluation of their in vitro antioxidant activities. Molecules 17(6): 6769-6783.
|


