The Journal of Animal & Plant Sciences, 30(1): 2020, Page: 91-97
ISSN: 1018-7081
POPULATION STRUCTURE AND LINKAGE DISEQUILIBRIUM ASSESSMENT AMONG COTTON VARIETIES FROM TWO IMPORTANT COTTON GROWING REGIONS IN PUNJAB, PAKISTAN
M. Saeed1*, S. Akram1, M. Azeem1, X. Song2*, X. Sun2, and M. Riaz3
1Department of Botany, Faculty of Life Sciences, Government College University, Faisalabad-Pakistan
2State Key Laboratory of Crop Biology/Agronomy College, Shandong Agricultural University, Taian 271018, China
3Cotton Research Station (CRS), Ayub Agricultural Research Institute (AARI), Faisalabad-Pakistan
Correspondence Author E-mail: saeed_pbg@gcuf.edu.pk; xlsong@sdau.edu.cn
ABSTRACT
Cotton (Gossypium hirsutum L.) is an important crop worldwide cultivated for natural fiber and vegetable oil purposes. Artificial selection for pyramiding desirable traits in cotton varieties has a great influence on molecular evolution of cotton genome and species. Population structure and linkage disequilibrium (LD) are two important attributes that shed light on the underlying molecular evolution and genetic diversity of a plant species cultivated in a particular ecological region. In this study, population structure and linkage disequilibrium were assessed among 25 cotton cultivars from two important ecological regions (Central Punjab and South Punjab) in Pakistan. The 25 cultivars were genotyped with 92 primer pairs of simple sequence repeats (SSR) markers. Population structure was assessed by STRUCTURE 2.0 software. Linkage disequilibrium was assessed by TASSEL 2.1 software. The STRUCTURE analysis revealed three subpopulations. Sixty-six pairs of loci (0.83%) showed a significant LD (P ≤ 0.001, r2 > 0.1). At P ≤ 0.001, three LD haplotypic blocks were identified on chr. 11 (A11), 16 (D7), and 23 (D9), indicating that artificial selection has had a strong influence on the molecular evolution of cotton crop in a specific ecological region.
Keywords: Artificial selection; Cotton; Ecological region; Linkage disequilibrium; Molecular evolution; Population structure
INTRODUCTION
Cotton is an important crop worldwide. It is the major source of natural fiber and edible oil. Main producers of cotton are China, India, USA and Pakistan. Some counties of mid-east such as Turkey, Egypt and Tajikistan are also important producers of cotton especially Egypt is famous for producing long staple (Pima) cotton. It is the second largest crop grown in Pakistan. About 26% (2.961 million ha) of the farming communities in Pakistan grow cotton. Pakistan is placed on fourth position in the ranking of cotton producing countries and ninth position for seed cotton yield/hectare. Cotton and related commodities contribute about 0.8% to GDP and 4.5% in agricultural value addition. During 2018-2019, total production of cotton was 9,861 thousand bales with 707 kg ha-1 average yield of seed cotton (Anonymous, 2019). In textile sector, cotton cloth, bed wear, cotton yarn, towels and raw cotton have share of 9.3%, 10.1%, 4.9%, 3.4% and 0.1% in total exports, respectively (Anonymous, 2019).
Population structure and linkage disequilibrium are two important attributes used to determine the genetic relatedness among individuals of a species and association of loci in a particular genome. Population structure is the composition of population determined by the genotypic data using a marker system. Different marker systems have been used such as random amplified polymorphic DNA (RAPD), inter-simple sequence repeat (ISSR), amplified fragment length polymorphism (AFLP), restriction fragment length polymorphism (RFLP) and simple sequence repeats (SSR) (Multani and Lyon, 1995; Iqbal et al., 1997; Abdalla et al., 2001). The most important marker to study a polyploid genome is simple sequence repeat (SSR) marker, because SSR markers are PCR-based (Zhang et al., 2015), highly polymorphic (Shan et al., 2016), codominant (Akkaya et al., 1995), and present throughout the entire genome (Hawkins et al., 2006). These characteristics make SSR a suitable marker system to study population structure and linkage disequilibrium.
Linkage disequilibrium (LD) is non-random association of alleles within a population at different loci (Karasmani et al., 2016). Actually, it is the difference in expected and observed allele frequencies. Alleles are randomly distributed by independent assortment (Flint-Garcia et al., 2003) and LD is association between two or more loci on the same chromosome or different chromosomes. LD depends on many factors such as selection, mutation, genetic drift and linkage (Slatkin, 2008). In this way, linkage disequilibrium plays a significant role in genetic identity of a structured population (Remington et al., 2001).
In Pakistan, more than 80% of cotton cultivation is in Punjab, 15% cotton is cultivated in Sindh, and the remaining 5% in rest of the country. There are three main cotton breeding research institutes in Punjab, namely, Cotton Research Station, Ayub Agricultural Research Institute (CRS-AARI), Faisalabad; Cotton Breeding Section, Nuclear Institute for Agriculture and Biology (NIAB), Faisalabad; and Central Cotton Research Institute (CCRI), Multan. These research institutes develop cotton varieties to be cultivated in different ecological regions of Punjab, Pakistan. CRS-AARI and NIAB develop cotton varieties to be cultivated mostly in central Punjab, Pakistan. CCRI, Multan develops cotton varieties to be cultivated in southern regions of Punjab, Pakistan. These two cotton growing regions have marked differences with regard to precipitation and day-night temperature during cotton growing season of April-September. As a result, the cotton varieties developed for these two cotton growing regions have greater differences in morphology, and thus are genetically diverse. In the present study, the population structure and linkage disequilibrium among 25 cotton cultivars developed for cultivation in two ecological regions of cotton production in Punjab, Pakistan were evaluated. This would shed light on underlying molecular evolution of varietal populations of cotton.
MATERIALS AND METHODS
Plant material and sampling: Twenty-five varieties of cotton (Gossypium hirsutum L.) were used in this study (Table 1). Of which, 16 were originated from Cotton Research Station (CRS), Ayub Agricultural Research Institute (AARI), Faisalabad and Nuclear Institute for Agriculture and Biology (NIAB), Faisalabad and nine varieties originated from Central Cotton Research Institute (CCRI), Multan. Seeds of these varieties were sown in field plot during 2017 at research area of CRS, AARI, Faisalabad. Fresh leaves from 35 days old plants were collected for DNA extraction and stored in ice.
DNA extraction and genotyping: DNA extraction and genotyping work was carried out at the Molecular Genetics and Genomics Lab, Department of Botany, Government College University, Faisalabad, Pakistan during 2017. DNA was extracted from 2 g fresh leaves tissues by using Aidlab Plant Mini Kit (Made in China, Cat # DN15) following the manufacturer’s protocol. DNA quantification was done by agarose gel electrophoresis and Nanodrop method. Ninety-two pairs of simple sequence repeats (SSR) primers, reported by Han et al. (2004; 2006), were used in genotyping through PCR on a thermal cycler (Super Cycler Kyratec, Australia). The mode of heat control lid was kept constant at 100 °C. PCR amplification program was configured with a denaturation step of 4 min at 95 °C; followed by 29 cycles of 45 s at 94 °C; 45 s at specific annealing temperature (i.e., 51, 55, or 57°C as specified for each SSR primer pair); and 1 min at 72 °C. The program ended with one final extension at 72 °C for 7 min. Then PCR product was held at 10°C for 1 min. Amplified products were separated by polyacrylamide gel electrophoresis (PAGE) by using 30% acrylamide:bis acrylamide solution (29:1). PCR products bands were developed with silver nitrate staining and visualized under fluorescent light. The base pair (bp) of visualized PCR products were noted by comparing with DNA ladder bands. Chromosomal positions of SSR markers were based on the results of Han et al. (2004; 2006).
Population structure analysis: Subpopulations were identified by STRUCTURE software (Pritchard and Wen, 2004) by using genotypic data of varieties as input file. Missing data was represented by “-9”. Admixture model was used with burn-in period of 50,000 followed by 100,000 MCMC repeats. The clusters (K) varying from 1 to 10 with five independent runs were performed. Structure analyses were performed for all 25 varieties, Faisalabad varieties (16 varieties), and Multan varieties (9 varieties) separately.
Analysis of linkage disequilibrium: Linkage disequilibrium (LD) was assessed by TASSEL 2.1 software (Bradbury et al., 2007). LD was found out by calculating the correlation coefficient (r2) and disequilibrium coefficient (D') between all pairs of markers. The statistic r2 represents the correlation between alleles at two loci, whereas D' determine whether or not recombination has occurred between a pair of alleles. All pairs of loci were characterized as linked or unlinked. The term “linked loci” meant the marker loci were located on the same chromosome, while “unlinked loci” meant the marker loci were located on different chromosomes. Similarly as for the structure analysis, LD analyses were also performed for all 25 varieties, Faisalabad varieties, and Multan varieties separately at 1000 permutations.
RESULTS AND DISCUSSION
Genotyping of plant material: Genotyping identified 1-4 alleles from each SSR primer pair. In total, 127 alleles were amplified. Respective alleles of a primer pair (locus) were designated by lowercase alphabets. For example, four alleles for the marker NAU1070 were designated as NAU1070a, NAU1070b, NAU1070c, and NAU1070d.
Population structure: STRUCTURE analysis of the combined data of 25 varieties yielded three subpopulations (Fig. 1). Subpopulation 1 contained CIM-473, BS-1, CIM-109, CIM-446, CIM-448, and CIM-496. Except for BS-1, all other varieties were developed at CCRI, Multan, Pakistan. Subpopulation 2 contained 4-F, B-557, BH-118, CIM-499, IR-NIAB-824, FH-113, FH-1000, FH-682, FH-900, FH-901, LSS, MNH-552, MNH-554, MS-39 and SLS-1. Except for CIM-499, all other varieties were developed at CRS-AARI and NIAB in Faisalabad, Pakistan. Subpopulation 3 contained CIM-506, CIM-482 and CIM-1100. All three varieties were developed at CCRI, Multan, Pakistan. MS-40 did not share > 50% genetic component to any subpopulation, so it was an admixture.
Structure analysis of the 16 varieties data of Faisalabad also identified three subpopulations. Subpopulation 1 contained 4-F, BS-1, FH-1000, MNH-552, MS-40 and SLS-1. Subpopulation 2 contained B-557, IR-NIAB-824, FH-682, and MNH-554. Subpopulation 3 contained BH-118, FH-113, FH-900, and MS-39. FH-901 and LSS did not share > 50% genetic component of any subpopulation, so these two varieties were admixture. STRUCTURE analysis of Multan varieties yielded two subpopulations. Subpopulation 1 contained CIM-473, CIM-109, CIM-446, CIM-448, CIM-496, and CIM-499. Subpopulation 2 contained CIM-482, CIM-506, and CIM-1100. Results of STRUCTURE analyses were in strong agreement with ecological distribution of cotton varieties. This indicated that artificial selection for desirable traits, suitable for a particular ecological region, had strong effect on structuring of cotton germplasm at molecular level.
Analysis of LD and LD haplotypic blocks: Analysis of LD in combined dataset of varieties indicated that 66 pairs of loci (0.83%) showed significant LD (P < 0.001, r2 > 0.1) (Table 2). LD plot of a subset of 10 pairs of SSR loci out of 66 is given in Figure 1. Making probability criteria less stringent, 394 (4.92%) and 2038 loci (25.47%) showed LD at (P < 0.01, r2 > 0.02) and (P < 0.05, r2 > 0.008), respectively. In Faisalabad data set, 9 pairs of loci (0.11%) showed LD (P < 0.001, r2 > 0.1). At less stringent criteria, 31 (0.39%) and 102 (1.28%) showed LD at (P < 0.01, r2 > 0.25) and (P < 0.05, r2 > 0.08), respectively. In Multan data set, 3 pairs of loci (0.04%) showed LD (P < 0.001, r2 < 0.1). At less stringent criteria, 29 (0.36%) and 192 (2.40%) showed LD at (P < 0.01, r2 > 0.4) and (P < 0.05, r2 > 0.2), respectively.
At P <0.001, three LD haplotypic blocks were identified on chr. 11 (A11), 16 (D7), and 23 (D9). These haplotypic blocks spanned 50.44, 18.93, and 140.07 cM, respectively. Marker NAU1368 (A8) showed strong inter-chromosomal LD (P < 0.001) with markers NAU437 (A2), NAU3053 (D7), and NAU1103. Marker NAU3695 (A11) showed strong LD (P < 0.001) with markers NAU1070 (D2), NAU3053 (D7), NAU1200, and JESPR274 (A9). Marker NAU2691 (D3) showed strong LD (P < 0.001) with markers NAU462 (A9), NAU3092 (D5), and NAU1200. Marker NAU2572 showed strong LD (P < 0.001) with markers BNL3280 (D13), NAU3901 (D1), and NAU2995 (A7).
Findings of this study indicated that artificial selection carried out for specific plant traits during the normal cotton breeding programs have had a strong effect on LD in cotton germplasm developed for cultivation in a particular ecological region. STRUCTURE analysis of combined dataset of 25 varieties yielded three subpopulations. This analysis precisely partitioned 25 varieties into subpopulations pertaining to their ecological areas of cultivation. This showed that artificial selection manifested during development of these varieties had contributed towards molecular evolution of these cotton varieties. Some specific traits were selected for these varieties to make them suitable for cultivation in specific ecological region. Varieties of central and southern regions in Punjab, Pakistan had great differences (such as with respect to precipitation, air humidity and growth temperature requirements) and these differences were clear shown by the population structure and LD assessment results.
Considerations for pyramiding particular traits in cotton varieties greatly affected length of LD haplotypic blocks on specific cotton chromosomes. Length of these haplotypic blocks was variable for different chromosomes. Three large haplotypic blocks were identified on chr. 11 (A11), 16 (D7), and 23 (D9). These haplotypic blocks spanned 50.44, 18.93, and 140.07 cM, respectively, which differed from previous reports in Gossypium hirsutum L. According to the (r2≥0.1) threshold, LD decays within a 335 Gossypium hirsutum germplasm collection were up to 25 cM (Abdurakhmonov et al., 2009), the landrace stocks had less than 10 cM, and more than 30 cM among 77 photoperiodic varieties (Abdurakhmonov et al., 2008). Moreover, LD decay in 81 Upland cotton cultivars was within 13–14 cM. Great differences in LD values were reported among different plant species as well as within the same species (Saeed et al., 2014). The different LD values from this and previous reports might be due to particular genetic make-up of cotton germplasm used. As the cotton germplasm used in the present study consisted of cotton varieties cultivated in two ecological regions in Punjab, Pakistan. This led to great sub-structuring and LD among various loci. Thus, cotton breeding and selection activities are influencing molecular evolution of cotton germplasm developed for cultivation in a particular ecological region.
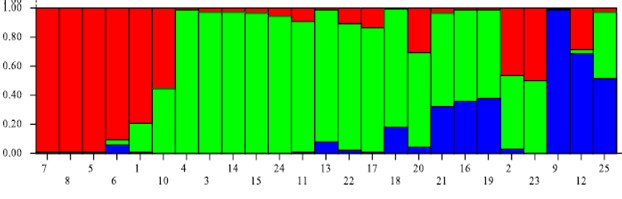
Fig. 1. Population structure in the combined dataset.
Note: Three subpopulations i.e., Subpopulation 1, Subpopulation 2, and Subpopulation 3 represented by red, green, and blue bars, respectively. A bar with 2 or 3 colours represents admixture.
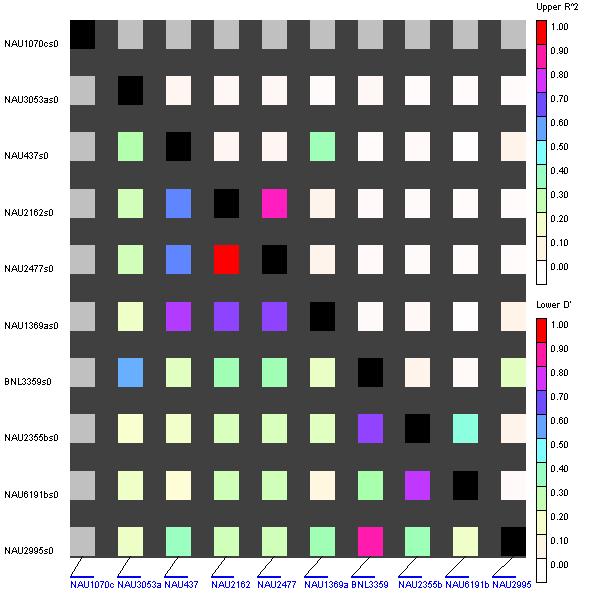
Fig. 2. Plot showing LD between 10 pairs of SSR loci.
Table 1. List of cotton varieties used in the study.
S. No. |
Variety Name |
Origin* |
1 |
CIM-473 |
CCRI, Multan |
2 |
4-F |
CRS, Faisalabad |
3 |
B-557 |
CRS, Faisalabad |
4 |
BH-118 |
CRS, Faisalabad |
5 |
BS-1 |
CRS, Faisalabad |
6 |
CIM-109 |
CCRI, Multan |
7 |
CIM-446 |
CCRI, Multan |
8 |
CIM-448 |
CCRI, Multan |
9 |
CIM-482 |
CCRI, Multan |
10 |
CIM-496 |
CCRI, Multan |
11 |
CIM-499 |
CCRI, Multan |
12 |
CIM-506 |
CCRI, Multan |
13 |
IR-NIAB-824 |
NIAB, Faisalabad |
14 |
FH-113 |
CRS, Faisalabad |
15 |
FH-1000 |
CRS, Faisalabad |
16 |
FH-682 |
CRS, Faisalabad |
17 |
FH-900 |
CRS, Faisalabad |
18 |
FH-901 |
CRS, Faisalabad |
19 |
LSS |
CRS, Faisalabad |
20 |
MNH-552 |
CRS, Faisalabad |
21 |
MNH-554 |
CRS, Faisalabad |
22 |
MS-39 |
CRS, Faisalabad |
23 |
MS-40 |
CRS, Faisalabad |
24 |
SLS-1 |
CRS, Faisalabad |
25 |
CIM-1100 |
CCRI, Multan |
*CRS: Cotton Research Station, Ayub Agricultural Research Institute, Faisalabad; NIAB: Nuclear Institute for Agriculture and Biology, Faisalabad; CCRI: Central Cotton Research Institute, Multan.
Table 2. Loci-pairs showing LD in combined dataset at P < 0.001.
S. No. |
Locus 1 |
Locus 2 |
r2 |
D′ |
P |
S. No. |
Locus 1 |
Locus 2 |
r2 |
D′ |
P |
1 |
NAU1070b |
NAU1070a |
0.8569 |
1 |
0 |
34 |
NAU3903 |
NAU3092a |
0.4059 |
0.9337 |
0 |
2 |
NAU1070d |
NAU1070c |
0.8009 |
1 |
0 |
35 |
NAU2572 |
NAU2995 |
0.2281 |
0.8933 |
0 |
3 |
NAU1141b |
NAU1141a |
0.8481 |
1 |
0 |
36 |
NAU2572 |
251 |
0.2970 |
0.86 |
0 |
4 |
JESPR274b |
JESPR274a |
0.8730 |
1 |
0 |
37 |
NAU2572 |
NAU3901b |
0.3429 |
0.7491 |
0 |
5 |
NAU1233b |
NAU1233a |
0.8551 |
1 |
0 |
38 |
NAU2540a |
NAU1070c |
0.0826 |
0.5265 |
0 |
6 |
NAU1233c |
NAU1233a |
0.6973 |
0.9565 |
0 |
39 |
NAU2540a |
NAU3901b |
0.1285 |
0.5949 |
0 |
7 |
NAU1233c |
NAU1233b |
0.6973 |
0.9565 |
0 |
40 |
NAU2540b |
NAU2540a |
0.6536 |
1 |
0 |
8 |
NAU3053a |
NAU1070c |
0.3892 |
0.7361 |
0 |
41 |
NAU2974 |
NAU3608a |
0.2682 |
0.6090 |
0 |
9 |
NAU3053b |
NAU3053a |
0.6950 |
0.96 |
0 |
42 |
NAU3092c |
NAU3092b |
1 |
1 |
0.0004 |
10 |
NAU3092b |
NAU3092a |
0.7216 |
1 |
0 |
43 |
JESPR291b |
JESPR291a |
0.6221 |
0.8333 |
0.0010 |
11 |
NAU3092c |
NAU3092a |
0.7216 |
1 |
0 |
44 |
NAU453 |
NAU808a |
0.2371 |
0.5833 |
0.0010 |
12 |
NAU2265b |
NAU2265a |
0.8623 |
1 |
0 |
45 |
NAU2265a |
NAU1141a |
0.2474 |
0.7014 |
0.0010 |
13 |
NAU2265c |
NAU2265a |
0.8623 |
1 |
0 |
46 |
NAU2265a |
NAU1141b |
0.2474 |
0.7014 |
0.0010 |
14 |
NAU2265c |
NAU2265b |
0.8623 |
1 |
0 |
47 |
NAU1369a |
NAU1103 |
0.2963 |
0.9095 |
0.0010 |
15 |
NAU2477 |
NAU2162 |
0.8807 |
1 |
0 |
48 |
NAU1369b |
NAU3053a |
0.2847 |
0.9074 |
0.0010 |
16 |
NAU1369a |
NAU437 |
0.3773 |
0.7674 |
0 |
49 |
NAU1369b |
NAU3053b |
0.3602 |
0.9267 |
0.0010 |
17 |
NAU3608b |
NAU3608a |
0.8647 |
1 |
0 |
50 |
NAU1366 |
NAU3053a |
0.2847 |
0.9074 |
0.0010 |
18 |
NAU2980b |
NAU2980a |
0.8846 |
1 |
0 |
51 |
NAU6191a |
NAU3095 |
0.1506 |
0.835 |
0.0010 |
19 |
NAU6191b |
NAU2355b |
0.4545 |
0.7806 |
0 |
52 |
NAU5189a |
NAU3100 |
0.2224 |
0.8799 |
0.0010 |
20 |
NAU2995 |
BNL3359 |
0.2445 |
0.8933 |
0 |
53 |
NAU3385 |
NAU3608b |
0.2207 |
0.5632 |
0.0010 |
21 |
NAU5189b |
NAU5189a |
0.8426 |
1 |
0 |
54 |
NAU3385 |
NAU6191a |
0.1874 |
0.5616 |
0.0010 |
22 |
NAU2697b |
NAU3095 |
0.3602 |
0.9267 |
0 |
55 |
NAU2691 |
NAU1200 |
0.2283 |
0.8859 |
0.0010 |
23 |
NAU2697b |
NAU2697a |
0.8681 |
1 |
0 |
56 |
NAU3901b |
NAU1070a |
0.1021 |
0.5 |
0.0010 |
24 |
NAU2691 |
NAU462 |
0.6158 |
0.9565 |
0 |
57 |
NAU3695 |
JESPR274a |
0.2017 |
0.8743 |
0.0010 |
25 |
NAU2691 |
NAU3092a |
0.6265 |
0.96 |
0 |
58 |
NAU3695 |
NAU3053a |
0.2320 |
0.8886 |
0.0010 |
26 |
NAU1266 |
NAU3053a |
0.2847 |
0.9074 |
0 |
59 |
NAU3695 |
NAU1200 |
0.2903 |
0.9079 |
0.0010 |
27 |
NAU1266 |
NAU1366 |
0.8937 |
1 |
0 |
60 |
NAU3903 |
NAU3100 |
0.2788 |
0.9028 |
0.0010 |
28 |
NAU3901b |
NAU3901a |
0.7825 |
1 |
0 |
61 |
NAU2572 |
BNL3280 |
0.3372 |
0.9247 |
0.0010 |
29 |
NAU3901c |
NAU3901a |
0.2233 |
0.7051 |
0 |
62 |
NAU2572 |
NAU3901a |
0.3654 |
0.76 |
0.0010 |
30 |
NAU3901c |
NAU3901b |
0.2164 |
0.7616 |
0 |
63 |
NAU2540b |
NAU1070c |
0.0826 |
0.5265 |
0.0010 |
31 |
NAU2016 |
NAU453 |
0.2664 |
0.9012 |
0 |
64 |
NAU2540b |
NAU3901b |
0.1285 |
0.5949 |
0.0010 |
32 |
NAU3695 |
NAU1070c |
0.2087 |
0.875 |
0 |
65 |
NAU3606 |
NAU3608b |
0.2847 |
0.9074 |
0.0010 |
33 |
NAU3695 |
NAU3053b |
0.1806 |
0.8628 |
0 |
66 |
NAU3703 |
NAU1350 |
0.3191 |
0.9156 |
0.0010 |
r2: correlation between alleles at two loci; D′ disequilibrium coefficient
Acknowledgements:
The financial support for this study was provided by the grants “9583/Punjab/NRPU/R&D/HEC/2017 of Higher Education Commission (HEC), Pakistan”, “System of Modern Agriculture Industrial Technology of Shandong province (SDAIT-07-011-02, SDAIT-03-03, SDAIT-03-05)”, “Agriculture Seed Project of Shandong province (2014 cotton variety development)”, and “Open Project number 2014KF01 of the State Key Laboratory of Crop Biology, Shandong Agricultural University, Shandong, China”. Authors also appreciate kind support offered by Cotton Research Station (CRS), Ayub Agricultural Research Institute (AARI), Faisalabad, Pakistan for field experimentation of the research activities of this research project.
REFERENCES
- Abdalla, A.M., O.U.K. Reddy, K.M. El-Zik and A.E. Pepper (2001). Genetic diversity and relationships of diploid and tetraploid cottons revealed using AFLP. Theor. Appl. Genet. 102: 222-229.
- Abdurakhmonov, I.Y., R.J. Kohel, J.Z. Yu, A.E. Pepper, A.A. Abdullaev, F. N. Kushanov and J.N. Jenkins ( 2008). Molecular diversity and association mapping of fiber quality traits in exotic G. hirsutum L. germplasm. Genomics 92: 478-487.
- Abdurakhmonov, I.Y., S. Saha, J.N. Jenkins, Z.T. Buriev, S.E. Shermatov, B.E. Scheffler and A. Abdukarimov (2009). Linkage disequilibrium based association mapping of fiber quality traits in G. hirsutum L. variety germplasm. Genetica 136: 401-417.
- Akkaya, M.S., R.C. Shoemaker, J.E. Specht, A.A. Bhagwat and P.B. Cregan (1995). Integration of simple sequence repeats DNA markers into a soybean linkage map. Crop Sci. 35: 1439-1445.
- Anonymous (2019). Economic Survey of Pakistan 2018-19. Finance Division, Economic Advisory Wings Islamabad, Pakistan.
- Bradbury, P.J., Z. Zhang, D.E. Kroon, T.M. Casstevens, Y. Ramdoss and E.S. Buckler (2007). TASSEL: software for association mapping of complex traits in diverse samples. Bioinformatics 23: 2633– 2635.
- Flint-Garcia, S.A., J.M. Thornsberry and E.S. Buckler IV (2003). Structure of linkage disequilibrium in plants. Annu. Rev. Plant Biol. 54: 357-374.
- Han, Z.G., W.Z. Guo, X.L. Song and T.Z. Zhang (2004). Genetic mapping of EST-derived microsatellites from the diploid Gossypium arboreum in allotetraploid cotton. Mol. Genet. Genomics 272: 308-327.
- Han Z.G., C.B. Wang, X.L. Song, W.Z. Guo, J.Y. Gou, C.H. Li, X.Y. Chen and T.Z. Zhang (2006). Characteristics, development and mapping of Gossypium hirsutum derived EST-SSRs in allotetraploid cotton. Theor. Appl. Genet. 112: 430-439.
- Hawkins, J. S., H. Kim, J.D. Nason, R.A. Wing and J.F. Wendel (2006). Differential lineage-specific amplification of transposable elements is responsible for genome size variation in Gossypium. Genome Res. 16: 1252-1261.
- Iqbal, M. J., N. Aziz, N.A. Saeed, Y. Zafar and K.A. Malik (1997). Genetic diversity evaluation of some elite cotton varieties by RAPD analysis. Theor. Appl. Genet.94: 139-144.
- Karasmani, E., S. Boehringer and A.W. van der Vaart (2016). Descriptive analysis and inference of higher-order linkage disequilibrium. Master Thesis, Leiden University, the Netherlands.
- Multani, D.S. and B.R. Lyon (1995). Genetic fingerprinting of Australian cotton cultivars with RAPD markers. Genome 38: 1005-1008.
- Pritchard, J.K. and W. Wen (2004). Documentation for Structure software. The University of Chicago Press, Chicago.
- Remington, D.L., J.M. Thornsberry, Y. Matsuoka, L.M. Wilson, S.R. Whitt, J. Doebley and E.S. Buckler (2001). Structure of linkage disequilibrium and phenotypic associations in the maize genome. Proc. Natl. Acad. Sci. U.S.A.98: 11479-11484.
- Saeed, M., W.-Z. Guo and T.-Z. Zhang (2014). Association mapping for salinity tolerance in cotton (Gossypium hirsutum L.) germplasm from US and diverse regions of China. Aus. J. Crop Sci. 8 (3): 338-346.
- Shan, W., Y. Jiang, J. Han and K. Wang (2016). Comprehensive cytological characterization of the Gossypium hirsutum genome based on the development of a set of chromosome cytological markers. Crop J. 4: 256-265.
- Slatkin, M. (2008). Linkage disequilibrium—understanding the evolutionary past and mapping the medical future. Nature Rev. Genet.9: 477-485.
- Zhang, T., Y. Hu, W. Jiang, L. Fang, X. Guan, J. Chen, and A.M. Hulse-Kemp (2015). Sequencing of allotetraploid cotton (Gossypium hirsutum L. acc. TM-1) provides a resource for fiber improvement. Nature Biotechnol. 33: 531-537.
|


